|
1400
|
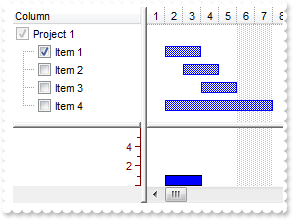
Is it possible to define my values for sorting
with G2antt1 do
begin
	(IUnknown(Columns.Add('C1')) as EXG2ANTTLib_TLB.Column).SortType := EXG2ANTTLib_TLB.SortUserDataString;
	Columns.Add('C2');
	with Items do
	begin
		h := AddItem('Cell 1');
		CellData[OleVariant(h),OleVariant(0)] := '3.your extra data';
		CellValue[OleVariant(h),OleVariant(1)] := 'SortValue=3';
		h := AddItem('Cell 1.1');
		CellData[OleVariant(h),OleVariant(0)] := '1.your extra data';
		CellValue[OleVariant(h),OleVariant(1)] := ' SortValue=1';
		h := AddItem('Cell 1.2');
		CellData[OleVariant(h),OleVariant(0)] := '5.your extra data';
		CellValue[OleVariant(h),OleVariant(1)] := ' SortValue=5';
		h := AddItem('Cell 1.3');
		CellData[OleVariant(h),OleVariant(0)] := '2.your extra data';
		CellValue[OleVariant(h),OleVariant(1)] := ' SortValue=2';
	end;
end
|
|
1399
|
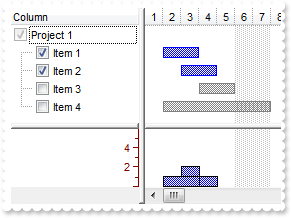
I have multiple dropdown lists, that are depending on each other, that means that the values in dropdown list no. 2 is based on the users selection in dropdown list no 1. How can I do this
// EditOpen event - Occurs when the edit operation starts.
procedure TForm1.G2antt1EditOpen(ASender: TObject; );
begin
	with G2antt1 do
	begin
		with Items do
		begin
			v := CellValue[OleVariant(FocusItem),OleVariant(0)];
			c := CellCaption[OleVariant(FocusItem),OleVariant(0)];
		end;
		with Columns.Item[OleVariant(1)].Editor do
		begin
			ClearItems();
			AddItem(v,c,Null);
		end;
	end
end;

with G2antt1 do
begin
	BeginUpdate();
	Chart.PaneWidth[True] := 0;
	with (IUnknown(Columns.Add('DropDownList')) as EXG2ANTTLib_TLB.Column) do
	begin
		with Editor do
		begin
			EditType := EXG2ANTTLib_TLB.DropDownListType;
			AddItem(1,'First',Null);
			AddItem(2,'Second',Null);
			AddItem(3,'Third',Null);
		end;
	end;
	DrawGridLines := EXG2ANTTLib_TLB.exAllLines;
	(IUnknown(Columns.Add('DropDownList-Related')) as EXG2ANTTLib_TLB.Column).Editor.EditType := EXG2ANTTLib_TLB.DropDownListType;
	with Items do
	begin
		CellValue[OleVariant(AddItem(OleVariant(1))),OleVariant(1)] := OleVariant(-1);
		CellValue[OleVariant(AddItem(OleVariant(2))),OleVariant(1)] := OleVariant(-1);
		CellValue[OleVariant(AddItem(OleVariant(3))),OleVariant(1)] := OleVariant(-1);
		LockedItemCount[EXG2ANTTLib_TLB.exBottom] := 1;
		h := LockedItem[EXG2ANTTLib_TLB.exBottom,0];
		ItemDivider[h] := 0;
		ItemDividerLineAlignment[h] := EXG2ANTTLib_TLB.DividerTop;
		CellEditorVisible[OleVariant(h),OleVariant(0)] := EXG2ANTTLib_TLB.exEditorHidden;
		CellSingleLine[OleVariant(h),OleVariant(0)] := EXG2ANTTLib_TLB.exCaptionWordWrap;
		CellValueFormat[OleVariant(h),OleVariant(0)] := EXG2ANTTLib_TLB.exHTML;
		CellValue[OleVariant(h),OleVariant(0)] := 'The drop down editor in the second column is filled during the <b>EditOpen event</b>, and the values are based on the selection ' +
	'on the first column.';
	end;
	EndUpdate();
end
|
|
1398
|
Is it possible background color displayed when the mouse passes over an item
with G2antt1 do
begin
	BeginUpdate();
	Columns.Add('Def');
	HotBackColor := RGB(0,0,128);
	HotForeColor := RGB(255,255,255);
	with Items do
	begin
		AddItem('Item A');
		AddItem('Item B');
		AddItem('Item C');
	end;
	EndUpdate();
end
|
|
1397
|
Is it possible to magnify a specified date and apply a different background color
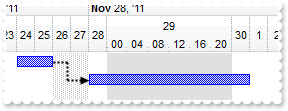
with G2antt1 do
begin
	BeginUpdate();
	Columns.Add('Tasks');
	with Chart do
	begin
		DrawLevelSeparator := EXG2ANTTLib_TLB.exLevelNoLine;
		PaneWidth[False] := 64;
		FirstVisibleDate := '11/23/2011';
		LevelCount := 3;
		FirstWeekDay := EXG2ANTTLib_TLB.exMonday;
		AllowInsideZoom := True;
		InsideZooms.Add('11/29/2011').AllowCustomFormat := True;
		with InsideZooms.Item['11/29/2011'] do
		begin
			Width := 68;
			CustomFormat.BackColorChart := $e0e0e0;
		end;
	end;
	with Items do
	begin
		hA := AddItem('Task A');
		AddBar(hA,'Task','11/24/2011','11/26/2011','A',Null);
		hB := AddItem('Task B');
		AddBar(hB,'Task','11/28/2011','12/1/2011','B',Null);
		AddLink('LinkAB',hA,'A',hB,'B');
		Link['LinkAB',EXG2ANTTLib_TLB.exLinkStyle] := OleVariant(2);
		Link['LinkAB',EXG2ANTTLib_TLB.exLinkWidth] := OleVariant(2);
	end;
	EndUpdate();
end
|
|
1396
|
Could you please tell me how to add multiple bars to the one line
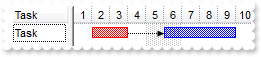
with G2antt1 do
begin
	BeginUpdate();
	Chart.FirstVisibleDate := '1/1/2002';
	Columns.Add('Task');
	with Items do
	begin
		h := AddItem('Task');
		AddBar(h,'Task','1/2/2002','1/4/2002','A',Null);
		AddBar(h,'Task','1/6/2002','1/10/2002','B',Null);
		ItemBar[h,'A',EXG2ANTTLib_TLB.exBarColor] := OleVariant(255);
		AddLink('AB',h,'A',h,'B');
	end;
	EndUpdate();
end
|
|
1395
|
My development environment does not have any Object,GetOcx,DefaultDispatch,GetControlUnknown,nativeObject, ... property, is there any alternative I can pass the component to PrintExt so I can get printed
with G2antt1 do
begin
	BeginUpdate();
	Columns.Add('Task');
	Chart.FirstVisibleDate := '1/1/2001';
	with Items do
	begin
		h1 := AddItem('Task 1');
		AddBar(h1,'Task','1/2/2001','1/4/2001','K1',Null);
		h2 := AddItem('Task 2');
		AddBar(h2,'Task','1/5/2001','1/7/2001','K2',Null);
		AddLink('L1',h1,'K1',h2,'K2');
		Link['L1',EXG2ANTTLib_TLB.exLinkStartPos] := OleVariant(0);
	end;
	EndUpdate();
	Template := 'Dim p;p = CreateObject(`Exontrol.Print`);p.PrintExt = Me;p.AutoRelease = False;p.Preview();';
end
|
|
1394
|
My development environment does not have any Object,GetOcx,DefaultDispatch,GetControlUnknown,nativeObject, ... property, is there any alternative I can pass the component to PrintExt so I can get printed
with G2antt1 do
begin
	BeginUpdate();
	Columns.Add('Task');
	Chart.FirstVisibleDate := '1/1/2001';
	with Items do
	begin
		h1 := AddItem('Task 1');
		AddBar(h1,'Task','1/2/2001','1/4/2001','K1',Null);
		h2 := AddItem('Task 2');
		AddBar(h2,'Task','1/5/2001','1/7/2001','K2',Null);
		AddLink('L1',h1,'K1',h2,'K2');
		Link['L1',EXG2ANTTLib_TLB.exLinkStartPos] := OleVariant(0);
	end;
	EndUpdate();
	with (IUnknown(ComObj.CreateComObject(ComObj.ProgIDToClassID('Exontrol.Print'))) as EXPRINTLib_TLB.Print) do
	begin
		PrintExt := (IUnknown(G2antt1.ExecuteTemplate('me')) as EXG2ANTTLib_TLB.G2antt);
		Preview();
	end;
end
|
|
1393
|
Is it possible to display the bar's captions or labels with a different font/size
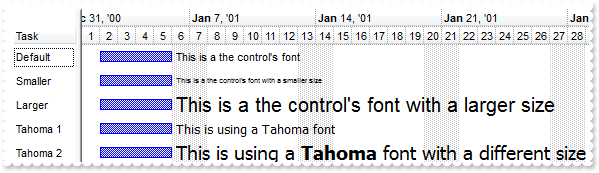
with G2antt1 do
begin
	BeginUpdate();
	Columns.Add('Task');
	DefaultItemHeight := 24;
	with Chart do
	begin
		PaneWidth[False] := 64;
		FirstVisibleDate := '1/1/2001';
		LevelCount := 2;
	end;
	with Items do
	begin
		h := AddItem('Default');
		AddBar(h,'Task','1/2/2001','1/6/2001','','This is a the control''s font');
		ItemBar[h,'',EXG2ANTTLib_TLB.exBarHAlignCaption] := OleVariant(18);
		h := AddItem('Smaller');
		AddBar(h,'Task','1/2/2001','1/6/2001','','<font ;5>This is a the control''s font with a smaller size');
		ItemBar[h,'',EXG2ANTTLib_TLB.exBarHAlignCaption] := OleVariant(18);
		h := AddItem('Larger');
		AddBar(h,'Task','1/2/2001','1/6/2001','','<font ;15>This is a the control''s font with a larger size');
		ItemBar[h,'',EXG2ANTTLib_TLB.exBarHAlignCaption] := OleVariant(18);
		h := AddItem('Tahoma 1');
		AddBar(h,'Task','1/2/2001','1/6/2001','','<font Tahoma>This is using a Tahoma font');
		ItemBar[h,'',EXG2ANTTLib_TLB.exBarHAlignCaption] := OleVariant(18);
		h := AddItem('Tahoma 2');
		AddBar(h,'Task','1/2/2001','1/6/2001','','<font Tahoma;14>This is using a <b>Tahoma</b> font with a different size');
		ItemBar[h,'',EXG2ANTTLib_TLB.exBarHAlignCaption] := OleVariant(18);
	end;
	EndUpdate();
end
|
|
1392
|
How can I apply the same ConditionalFormat on more than 1(one) column (multiple columns and not on item)
with G2antt1 do
begin
	BeginUpdate();
	with ConditionalFormats.Add('1','K1') do
	begin
		BackColor := $ff;
		ApplyTo := EXG2ANTTLib_TLB.FormatApplyToEnum($1);
	end;
	with ConditionalFormats.Add('1','K2') do
	begin
		BackColor := $ff;
		ApplyTo := EXG2ANTTLib_TLB.FormatApplyToEnum($2);
	end;
	MarkSearchColumn := False;
	DrawGridLines := EXG2ANTTLib_TLB.exRowLines;
	with Columns do
	begin
		Add('Column 1');
		Add('Column 2');
		Add('Column 3');
	end;
	with Items do
	begin
		AddItem(Null);
		AddItem(Null);
		AddItem(Null);
	end;
	EndUpdate();
end
|
|
1391
|
Is it possible to change the height for all items at once
with G2antt1 do
begin
	BeginUpdate();
	LinesAtRoot := EXG2ANTTLib_TLB.exLinesAtRoot;
	Columns.Add('Items');
	with Items do
	begin
		h := AddItem('Root 1');
		InsertItem(h,Null,'Child 1');
		InsertItem(h,Null,'Child 2');
		h := AddItem('Root 2');
		InsertItem(h,Null,'Child 1');
		InsertItem(h,Null,'Child 2');
		ExpandItem[0] := True;
	end;
	EndUpdate();
	DefaultItemHeight := 12;
	Items.ItemHeight[0] := 12;
end
|
|
1390
|
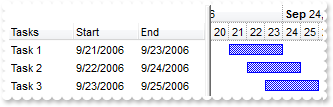
Is it possible to include the weekday when displaying the date
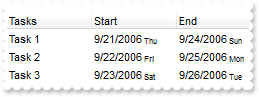
with G2antt1 do
begin
	BeginUpdate();
	MarkSearchColumn := False;
	with Columns do
	begin
		Add('Tasks');
		with (IUnknown(Add('Start')) as EXG2ANTTLib_TLB.Column) do
		begin
			Def[EXG2ANTTLib_TLB.exCellValueToItemBarProperty] := OleVariant(1);
			Def[EXG2ANTTLib_TLB.exCellValueFormat] := OleVariant(1);
			FormatColumn := 'value + ''<font ;6> ''  + (weekday(date(value)) case(0:''Sun'';1:''Mon'';2:''Tue'';3:''Wed'';4:''Thu'';5:''Fri'';6:''Sat''))';
		end;
		with (IUnknown(Add('End')) as EXG2ANTTLib_TLB.Column) do
		begin
			Def[EXG2ANTTLib_TLB.exCellValueToItemBarProperty] := OleVariant(2);
			Def[EXG2ANTTLib_TLB.exCellValueFormat] := OleVariant(1);
			FormatColumn := 'value + ''<font ;6> ''  + (weekday(date(value)) case(0:''Sun'';1:''Mon'';2:''Tue'';3:''Wed'';4:''Thu'';5:''Fri'';6:''Sat''))';
		end;
	end;
	with Chart do
	begin
		FirstVisibleDate := '9/20/2006';
		AllowLinkBars := False;
		AllowCreateBar := EXG2ANTTLib_TLB.exNoCreateBar;
		LevelCount := 2;
		PaneWidth[False] := 256;
		NonworkingDays := 0;
		FirstWeekDay := EXG2ANTTLib_TLB.exMonday;
	end;
	with Items do
	begin
		AllowCellValueToItemBar := True;
		AddBar(AddItem('Task 1'),'Task','9/21/2006','9/24/2006',Null,Null);
		AddBar(AddItem('Task 2'),'Task','9/22/2006','9/25/2006',Null,Null);
		AddBar(AddItem('Task 3'),'Task','9/23/2006','9/26/2006',Null,Null);
	end;
	EndUpdate();
end
|
|
1389
|
I need my chart to display the end date with on day less. How can I do this (Method 1)
with G2antt1 do
begin
	BeginUpdate();
	MarkSearchColumn := False;
	with Columns do
	begin
		Add('Tasks');
		(IUnknown(Add('Start')) as EXG2ANTTLib_TLB.Column).Def[EXG2ANTTLib_TLB.exCellValueToItemBarProperty] := OleVariant(1);
		with (IUnknown(Add('End')) as EXG2ANTTLib_TLB.Column) do
		begin
			Def[EXG2ANTTLib_TLB.exCellValueToItemBarProperty] := OleVariant(2);
			FormatColumn := 'shortdate(date(value)-1)';
		end;
	end;
	with Chart do
	begin
		FirstVisibleDate := '9/20/2006';
		AllowLinkBars := False;
		AllowCreateBar := EXG2ANTTLib_TLB.exNoCreateBar;
		LevelCount := 2;
		PaneWidth[False] := 196;
		NonworkingDays := 0;
	end;
	with Items do
	begin
		AllowCellValueToItemBar := True;
		AddBar(AddItem('Task 1'),'Task','9/21/2006','9/24/2006',Null,Null);
		AddBar(AddItem('Task 2'),'Task','9/22/2006','9/25/2006',Null,Null);
		AddBar(AddItem('Task 3'),'Task','9/23/2006','9/26/2006',Null,Null);
	end;
	EndUpdate();
end
|
|
1388
|
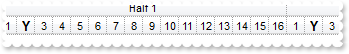
Is it possible to display my custom time-units
with G2antt1 do
begin
	with Chart do
	begin
		PaneWidth[False] := 0;
		LevelCount := 2;
		FirstVisibleDate := OleVariant(0);
		NonworkingDays := 0;
		with Level[0] do
		begin
			Unit := EXG2ANTTLib_TLB.exDay;
			Count := 16;
			Alignment := EXG2ANTTLib_TLB.CenterAlignment;
			Label := '<%i%>';
			FormatLabel := '''Half '' + (1 + (value/16) mod 2)';
		end;
		with Level[1] do
		begin
			Label := '<%i%>';
			FormatLabel := '1 + value mod 16';
			ReplaceLabel[2] := '<font ;10><B>Y';
		end;
		AdjustLevelsToBase := True;
		ScrollRange[EXG2ANTTLib_TLB.exStartDate] := OleVariant(0);
		ScrollRange[EXG2ANTTLib_TLB.exEndDate] := OleVariant(31);
	end;
end
|
|
1387
|
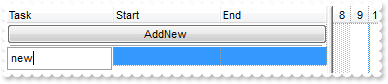
Is it possible to add new records and see them in the control's view using the DataSource
// AddItem event - Occurs after a new Item has been inserted to Items collection.
procedure TForm1.G2antt1AddItem(ASender: TObject; Item : HITEM);
begin
	with G2antt1 do
	begin
		with Items do
		begin
			SelectItem[Item] := True;
			EnsureVisibleItem(Item);
		end;
		Edit(OleVariant(0));
	end
end;

// ButtonClick event - Occurs when user clicks on the cell's button.
procedure TForm1.G2antt1ButtonClick(ASender: TObject; Item : HITEM; ColIndex : Integer; Key : OleVariant);
begin
	with G2antt1 do
	begin
		(IUnknown(DataSource) as ADODB_TLB.Recordset).AddNew(Null,Null);
	end
end;

with G2antt1 do
begin
	rs := (IUnknown(ComObj.CreateComObject(ComObj.ProgIDToClassID('ADODB.Recordset'))) as ADODB_TLB.Recordset);
	with rs.Fields do
	begin
		Append('Task',8,Null,Null,Null);
		Append('Start',7,Null,Null,Null);
		Append('End',7,Null,Null,Null);
	end;
	rs.Open(Null,Null,Null,Null,Null);
	DrawGridLines := EXG2ANTTLib_TLB.exRowLines;
	DetectAddNew := True;
	DetectDelete := True;
	DataSource := (IUnknown(rs) as ADODB_TLB.Recordset);
	with Items do
	begin
		LockedItemCount[EXG2ANTTLib_TLB.exTop] := 1;
		h := LockedItem[EXG2ANTTLib_TLB.exTop,0];
		ItemDivider[h] := 0;
		ItemHeight[h] := 22;
		CellValue[OleVariant(h),OleVariant(0)] := 'AddNew';
		CellHasButton[OleVariant(h),OleVariant(0)] := True;
		CellHAlignment[OleVariant(h),OleVariant(0)] := EXG2ANTTLib_TLB.CenterAlignment;
	end;
end
|
|
1386
|
How can I limit the bars to scrolling range only
// CreateBar event - Fired when the user creates a new bar.
procedure TForm1.G2antt1CreateBar(ASender: TObject; Item : HITEM; DateStart : TDateTime; DateEnd : TDateTime);
begin
	with G2antt1 do
	begin
		with Items do
		begin
			ItemBar[Item,'newbar',EXG2ANTTLib_TLB.exBarMinStart] := G2antt1.Chart.ScrollRange[EXG2ANTTLib_TLB.exMinDate];
			ItemBar[Item,'newbar',EXG2ANTTLib_TLB.exBarMaxEnd] := G2antt1.Chart.ScrollRange[EXG2ANTTLib_TLB.exMaxDate];
		end;
	end
end;

with G2antt1 do
begin
	BeginUpdate();
	Columns.Add('Task');
	with Chart do
	begin
		LevelCount := 2;
		PaneWidth[False] := 56;
		ScrollRange[EXG2ANTTLib_TLB.exStartDate] := '1/1/2001';
		ScrollRange[EXG2ANTTLib_TLB.exEndDate] := '1/15/2001';
		FirstVisibleDate := '1/12/2001';
		AllowCreateBar := EXG2ANTTLib_TLB.exCreateBarAuto;
	end;
	with Items do
	begin
		AddItem('Task 1');
		AddItem('Task 2');
		AddItem('Task 3');
	end;
	EndUpdate();
end
|
|
1385
|
How do I get the handle of the last added item
with G2antt1 do
begin
	Columns.Add('Def');
	with Items do
	begin
		AddItem(OleVariant(1));
		AddItem(OleVariant(2));
		OutputDebugString( ItemByIndex[ItemCount] );
	end;
end
|
|
1384
|
How can I set the charts date format to any other international Format then the US version. I would need "dd.mmm.yyyy" instead of "mmm.d.'yy"
with G2antt1 do
begin
	with Chart do
	begin
		PaneWidth[False] := 0;
		LevelCount := 2;
		with Level[0] do
		begin
			Label := '<%dd%>.<%mmm%>.<%yyyy%>';
			Unit := EXG2ANTTLib_TLB.exWeek;
			Alignment := Integer(EXG2ANTTLib_TLB.exHOutside) Or Integer(EXG2ANTTLib_TLB.CenterAlignment);
		end;
	end;
end
|
|
1383
|
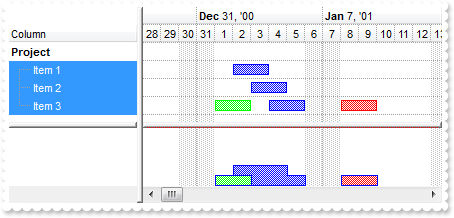
Is it possible to define the bar colors, and have the cumulative histogram showing the same colors
with G2antt1 do
begin
	BeginUpdate();
	SingleSel := False;
	with Chart do
	begin
		LevelCount := 2;
		AllowLinkBars := False;
		DrawGridLines := EXG2ANTTLib_TLB.exAllLines;
		FirstVisibleDate := '12/24/2000';
		HistogramVisible := True;
		HistogramHeight := 64;
		PaneWidth[False] := 128;
		HistogramView := Integer(EXG2ANTTLib_TLB.exHistogramNoGrouping) Or Integer(EXG2ANTTLib_TLB.exHistogramLeafItems) Or Integer(EXG2ANTTLib_TLB.exHistogramUnlockedItems) Or Integer(EXG2ANTTLib_TLB.exHistogramSelectedItems);
		with Bars.Item['Task'] do
		begin
			HistogramType := EXG2ANTTLib_TLB.exHistCumulative;
			HistogramItems := 6;
			HistogramPattern := Pattern;
			HistogramCumulativeOriginalColorBars := EXG2ANTTLib_TLB.exKeepOriginalColor;
			OverlaidType := EXG2ANTTLib_TLB.exOverlaidBarsOffset;
		end;
	end;
	Columns.Add('Column');
	with Items do
	begin
		h := AddItem('Project');
		ItemBold[h] := True;
		SelectableItem[h] := False;
		h1 := InsertItem(h,Null,'Item 1');
		AddBar(h1,'Task','1/2/2001','1/4/2001',Null,Null);
		h1 := InsertItem(h,Null,'Item 2');
		AddBar(h1,'Task','1/3/2001','1/5/2001',Null,Null);
		h1 := InsertItem(h,Null,'Item 3');
		AddBar(h1,'Task','1/4/2001','1/6/2001',Null,Null);
		AddBar(h1,'Task','1/1/2001','1/3/2001','green',Null);
		ItemBar[h1,'green',EXG2ANTTLib_TLB.exBarColor] := OleVariant(65280);
		AddBar(h1,'Task','1/8/2001','1/10/2001','red',Null);
		ItemBar[h1,'red',EXG2ANTTLib_TLB.exBarColor] := OleVariant(255);
		ExpandItem[h] := True;
		SelectAll();
	end;
	EndUpdate();
end
|
|
1382
|
How can I hide the values shown in the legend when cumulative histogram is displayed
with G2antt1 do
begin
	BeginUpdate();
	with Chart do
	begin
		FirstVisibleDate := '1/1/2001';
		HistogramVisible := True;
		HistogramHeight := 64;
		PaneWidth[False] := 128;
		HistogramView := Integer(EXG2ANTTLib_TLB.exHistogramNoGrouping) Or Integer(EXG2ANTTLib_TLB.exHistogramLeafItems) Or Integer(EXG2ANTTLib_TLB.exHistogramUnlockedItems) Or Integer(EXG2ANTTLib_TLB.exHistogramCheckedItems);
		with Bars.Item['Task'] do
		begin
			HistogramPattern := EXG2ANTTLib_TLB.exPatternSolid;
			HistogramType := EXG2ANTTLib_TLB.exHistCumulative;
			HistogramItems := 6;
			HistogramRulerLinesColor := $80;
			HistogramBorderColor := $1;
			HistogramCumulativeShowLegend := 65535;
			HistogramCumulativeOriginalColorBars := EXG2ANTTLib_TLB.exChangeColor;
		end;
	end;
	with (IUnknown(Columns.Add('Column')) as EXG2ANTTLib_TLB.Column) do
	begin
		Def[EXG2ANTTLib_TLB.exCellHasCheckBox] := OleVariant(True);
		PartialCheck := True;
	end;
	with Items do
	begin
		h := AddItem('Project 1');
		AddBar(InsertItem(h,Null,'Item 1'),'Task','1/2/2001','1/4/2001',Null,Null);
		AddBar(InsertItem(h,Null,'Item 2'),'Task','1/3/2001','1/5/2001',Null,Null);
		AddBar(InsertItem(h,Null,'Item 3'),'Task','1/4/2001','1/6/2001',Null,Null);
		AddBar(InsertItem(h,Null,'Item 4'),'Task','1/2/2001','1/8/2001',Null,Null);
		CellState[OleVariant(ItemByIndex[1]),OleVariant(0)] := 1;
		ExpandItem[h] := True;
	end;
	EndUpdate();
end
|
|
1381
|
Is it possible to define the bar colors, and have the cumulative histogram showing the same colors
with G2antt1 do
begin
	BeginUpdate();
	SelBackColor := BackColor;
	SelForeColor := ForeColor;
	with Chart do
	begin
		FirstVisibleDate := '1/1/2001';
		HistogramVisible := True;
		HistogramHeight := 64;
		PaneWidth[False] := 128;
		HistogramView := Integer(EXG2ANTTLib_TLB.exHistogramNoGrouping) Or Integer(EXG2ANTTLib_TLB.exHistogramLeafItems) Or Integer(EXG2ANTTLib_TLB.exHistogramUnlockedItems) Or Integer(EXG2ANTTLib_TLB.exHistogramCheckedItems);
		with Bars.Item['Task'] do
		begin
			Color := $808080;
			HistogramType := EXG2ANTTLib_TLB.exHistCumulative;
			HistogramItems := 6;
			HistogramRulerLinesColor := $80;
			HistogramBorderColor := $1;
			HistogramCumulativeColors := 2;
			HistogramCumulativeColor[0] := $ff0000;
			HistogramCumulativeColor[1] := $ff0000;
			HistogramCumulativeOriginalColorBars := EXG2ANTTLib_TLB.exChangeColor;
			HistogramPattern := Pattern;
			HistogramCumulativeShowLegend := 65535;
		end;
	end;
	with (IUnknown(Columns.Add('Column')) as EXG2ANTTLib_TLB.Column) do
	begin
		Def[EXG2ANTTLib_TLB.exCellHasCheckBox] := OleVariant(True);
		PartialCheck := True;
	end;
	with Items do
	begin
		h := AddItem('Project 1');
		AddBar(InsertItem(h,Null,'Item 1'),'Task','1/2/2001','1/4/2001',Null,Null);
		AddBar(InsertItem(h,Null,'Item 2'),'Task','1/3/2001','1/5/2001',Null,Null);
		AddBar(InsertItem(h,Null,'Item 3'),'Task','1/4/2001','1/6/2001',Null,Null);
		AddBar(InsertItem(h,Null,'Item 4'),'Task','1/2/2001','1/8/2001',Null,Null);
		CellState[OleVariant(ItemByIndex[1]),OleVariant(0)] := 1;
		ExpandItem[h] := True;
	end;
	EndUpdate();
end
|
|
1380
|
Is it possible to show the non-working pattern over the bars
with G2antt1 do
begin
	BeginUpdate();
	Columns.Add('Tasks');
	with Chart do
	begin
		NonworkingDaysPattern := EXG2ANTTLib_TLB.exPatternBDiagonal;
		NonworkingDaysColor := $0;
		PaneWidth[False] := 40;
		FirstVisibleDate := '6/20/2005';
		HistogramVisible := True;
		HistogramHeight := 64;
		HistogramView := Integer(EXG2ANTTLib_TLB.exHistogramBackground) Or Integer(EXG2ANTTLib_TLB.exHistogramAllItems);
		LevelCount := 2;
		with Bars do
		begin
			with Add('Empty') do
			begin
				Color := $0;
				Pattern := EXG2ANTTLib_TLB.exPatternFDiagonal;
				Shape := EXG2ANTTLib_TLB.exShapeSolidFrameless;
			end;
			with Add('Task:Empty') do
			begin
				Shortcut := 'Task';
				HistogramItems := -5;
				HistogramCriticalValue := 3;
				HistogramType := EXG2ANTTLib_TLB.exHistOverload;
				HistogramPattern := Pattern;
				Def[EXG2ANTTLib_TLB.exBarCaption] := '<%=%258%> working days bar';
				Def[EXG2ANTTLib_TLB.exBarHAlignCaption] := OleVariant(18);
				Def[EXG2ANTTLib_TLB.exBarKeepWorkingCount] := OleVariant(True);
			end;
		end;
		UnitWidthNonworking := -12;
		Level[1].FormatLabel := 'weekday(dvalue) in (0,6) ? `` : value';
	end;
	with Items do
	begin
		AddBar(AddItem('Task A'),'Task','6/23/2005','6/29/2005','',Null);
		AddBar(AddItem('Task B'),'Task','6/24/2005','6/28/2005','',Null);
	end;
	EndUpdate();
end
|
|
1379
|
I'm showing values from a ado recordset from sql 2005. When I try to edit a column with integers, it just skips back to the original numbers after pressing enter..., why
// AddItem event - Occurs after a new Item has been inserted to Items collection.
procedure TForm1.G2antt1AddItem(ASender: TObject; Item : HITEM);
begin
	with G2antt1 do
	begin
		with Items do
		begin
			AddBar(Item,'Task',CellValue[OleVariant(Item),OleVariant(2)],CellValue[OleVariant(Item),OleVariant(4)],Null,Null);
		end;
	end
end;

// Error event - Fired when an internal error occurs.
procedure TForm1.G2antt1Error(ASender: TObject; Error : Integer; Description : WideString);
begin
	with G2antt1 do
	begin
		OutputDebugString( Error );
		OutputDebugString( Description );
	end
end;

with G2antt1 do
begin
	BeginUpdate();
	with Chart do
	begin
		FirstVisibleDate := '8/3/1994';
		PaneWidth[False] := 256;
		LevelCount := 2;
		UnitScale := EXG2ANTTLib_TLB.exDay;
		FirstWeekDay := EXG2ANTTLib_TLB.exMonday;
		OverviewVisible := EXG2ANTTLib_TLB.exOverviewShowAllVisible;
	end;
	ColumnAutoResize := False;
	ContinueColumnScroll := False;
	rs := (IUnknown(ComObj.CreateComObject(ComObj.ProgIDToClassID('ADOR.Recordset'))) as ADODB_TLB.Recordset);
	with rs do
	begin
		Open('Orders','Provider=Microsoft.ACE.OLEDB.12.0;Data Source=C:\Program Files\Exontrol\ExG2antt\Sample\Access\misc.accdb',1,1,Null);
	end;
	DataSource := (IUnknown(rs) as ADODB_TLB.Recordset);
	Items.AllowCellValueToItemBar := True;
	Columns.Item[OleVariant(2)].Def[EXG2ANTTLib_TLB.exCellValueToItemBarProperty] := OleVariant(1);
	Columns.Item[OleVariant(4)].Def[EXG2ANTTLib_TLB.exCellValueToItemBarProperty] := OleVariant(2);
	EndUpdate();
end
|
|
1378
|
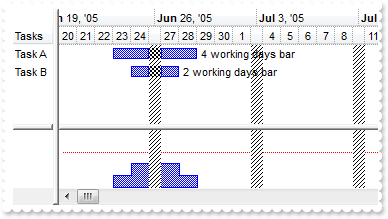
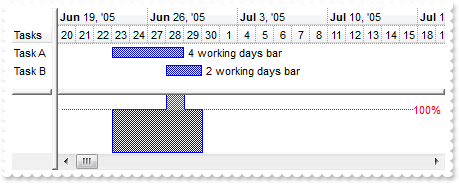
Is it possible to reduce the non-working parts of the control
with G2antt1 do
begin
	BeginUpdate();
	Columns.Add('Tasks');
	with Chart do
	begin
		PaneWidth[False] := 40;
		FirstVisibleDate := '6/20/2005';
		HistogramVisible := True;
		HistogramHeight := 64;
		HistogramView := EXG2ANTTLib_TLB.exHistogramAllItems;
		LevelCount := 2;
		with Bars.Item['Task'] do
		begin
			HistogramType := EXG2ANTTLib_TLB.exHistOverAllocation;
			HistogramPattern := Pattern;
		end;
		UnitWidthNonworking := -8;
		Level[1].FormatLabel := 'weekday(dvalue) in (0,6) ? `` : value';
	end;
	with Items do
	begin
		h := AddItem('Task A');
		AddBar(h,'Task','6/23/2005','6/29/2005','','4 working days bar');
		ItemBar[h,'',EXG2ANTTLib_TLB.exBarCanResize] := OleVariant(False);
		ItemBar[h,'',EXG2ANTTLib_TLB.exBarHAlignCaption] := OleVariant(18);
		ItemBar[h,'',EXG2ANTTLib_TLB.exBarEffort] := OleVariant(4);
		ItemBar[h,'',EXG2ANTTLib_TLB.exBarKeepWorkingCount] := OleVariant(True);
		h := AddItem('Task B');
		AddBar(h,'Task','6/28/2005','6/30/2005','','2 working days bar');
		ItemBar[h,'',EXG2ANTTLib_TLB.exBarCanResize] := OleVariant(False);
		ItemBar[h,'',EXG2ANTTLib_TLB.exBarHAlignCaption] := OleVariant(18);
		ItemBar[h,'',EXG2ANTTLib_TLB.exBarEffort] := OleVariant(2);
		ItemBar[h,'',EXG2ANTTLib_TLB.exBarKeepWorkingCount] := OleVariant(True);
	end;
	EndUpdate();
end
|
|
1377
|
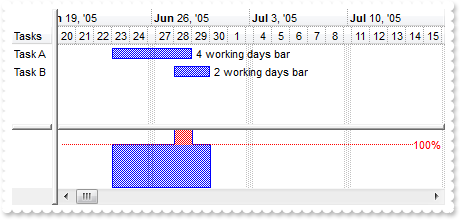
I don't want to see the "schedule"/show "workload" in non-working days part of the histogram
with G2antt1 do
begin
	BeginUpdate();
	Columns.Add('Tasks');
	with Chart do
	begin
		PaneWidth[False] := 40;
		FirstVisibleDate := '6/20/2005';
		HistogramVisible := True;
		HistogramHeight := 64;
		HistogramView := EXG2ANTTLib_TLB.exHistogramAllItems;
		LevelCount := 2;
		with Bars.Item['Task'] do
		begin
			HistogramType := EXG2ANTTLib_TLB.exHistOverAllocation;
			HistogramPattern := Pattern;
		end;
		ShowNonworkingDates := False;
		ShowNonworkingUnits := False;
	end;
	with Items do
	begin
		h := AddItem('Task A');
		AddBar(h,'Task','6/23/2005','6/29/2005','','4 working days bar');
		ItemBar[h,'',EXG2ANTTLib_TLB.exBarCanResize] := OleVariant(False);
		ItemBar[h,'',EXG2ANTTLib_TLB.exBarHAlignCaption] := OleVariant(18);
		ItemBar[h,'',EXG2ANTTLib_TLB.exBarEffort] := OleVariant(4);
		ItemBar[h,'',EXG2ANTTLib_TLB.exBarKeepWorkingCount] := OleVariant(True);
		h := AddItem('Task B');
		AddBar(h,'Task','6/28/2005','6/30/2005','','2 working days bar');
		ItemBar[h,'',EXG2ANTTLib_TLB.exBarCanResize] := OleVariant(False);
		ItemBar[h,'',EXG2ANTTLib_TLB.exBarHAlignCaption] := OleVariant(18);
		ItemBar[h,'',EXG2ANTTLib_TLB.exBarEffort] := OleVariant(2);
		ItemBar[h,'',EXG2ANTTLib_TLB.exBarKeepWorkingCount] := OleVariant(True);
	end;
	EndUpdate();
end
|
|
1376
|
The control shows, and handles non-working days PERFECT, but how is it possible to reflect this in the Histogram. I don't want to "schedule"/show "workload" in non-working days...
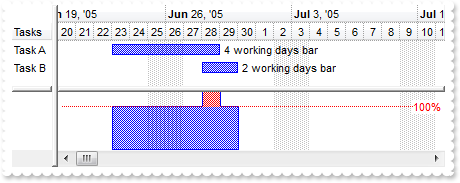
with G2antt1 do
begin
	BeginUpdate();
	Columns.Add('Tasks');
	with Chart do
	begin
		PaneWidth[False] := 40;
		FirstVisibleDate := '6/20/2005';
		HistogramVisible := True;
		HistogramHeight := 64;
		HistogramView := EXG2ANTTLib_TLB.exHistogramAllItems;
		LevelCount := 2;
		with Bars.Item['Task'] do
		begin
			HistogramType := EXG2ANTTLib_TLB.exHistOverAllocation;
			HistogramPattern := Pattern;
		end;
	end;
	with Items do
	begin
		h := AddItem('Task A');
		AddBar(h,'Task','6/23/2005','6/29/2005','','4 working days bar');
		ItemBar[h,'',EXG2ANTTLib_TLB.exBarCanResize] := OleVariant(False);
		ItemBar[h,'',EXG2ANTTLib_TLB.exBarHAlignCaption] := OleVariant(18);
		ItemBar[h,'',EXG2ANTTLib_TLB.exBarEffort] := OleVariant(4);
		ItemBar[h,'',EXG2ANTTLib_TLB.exBarKeepWorkingCount] := OleVariant(True);
		h := AddItem('Task B');
		AddBar(h,'Task','6/28/2005','6/30/2005','','2 working days bar');
		ItemBar[h,'',EXG2ANTTLib_TLB.exBarCanResize] := OleVariant(False);
		ItemBar[h,'',EXG2ANTTLib_TLB.exBarHAlignCaption] := OleVariant(18);
		ItemBar[h,'',EXG2ANTTLib_TLB.exBarEffort] := OleVariant(2);
		ItemBar[h,'',EXG2ANTTLib_TLB.exBarKeepWorkingCount] := OleVariant(True);
	end;
	EndUpdate();
end
|
|
1375
|
When I do select the button in the overview-zoom I want the scaling to change accordingly. Can I set different scales per selected zoom level
// OverviewZoom event - Occurs once the user selects a new time scale unit in the overview zoom area.
procedure TForm1.G2antt1OverviewZoom(ASender: TObject; );
begin
	with G2antt1 do
	begin
		OutputDebugString( Chart.UnitScale );
	end
end;

with G2antt1 do
begin
	with Chart do
	begin
		PaneWidth[False] := 0;
		LevelCount := 2;
		OverviewVisible := EXG2ANTTLib_TLB.exOverviewShowAllVisible;
		AllowOverviewZoom := EXG2ANTTLib_TLB.exAlwaysZoom;
		Label[EXG2ANTTLib_TLB.exSecond] := '';
		Label[EXG2ANTTLib_TLB.exYear] := '';
	end;
end
|
|
1374
|
How do I display Icons instead of text in the overview zoom area
with G2antt1 do
begin
Images('gBJJgBAIDAAGAAEAAQhYAf8Pf4hh0QihCJo2AEZjQAjEZFEaIEaEEaAIAkcbk0olUrlktl0vmExmUzmk1m03nE5nU7nk9n0/oFBoVDolFo1HpFJpVLplNp1PqFRqVTql' +
'Vq1XrFZrVbrldr1fsFhsVjslls1ntFptVrtltt1vuFxuVzul1u13vF5vV7vl9v1/wGBwWDwmFw2HxGJxWLxmNx0xiFdyOTh8Tf9ZymXx+QytcyNgz8r0OblWjyWds+m0' +
'ka1Vf1ta1+r1mos2xrG2xeZ0+a0W0qOx3GO4NV3WeyvD2XJ5XL5nN51aiw+lfSj0gkUkAEllHanHI5j/cHg8EZf7w8vl8j4f/qfEZeB09/vjLAB30+kZQAP/P5/H6/yN' +
'AOAEAwCjMBwFAEDwJBMDwLBYAP2/8Hv8/gAGAD8LQs9w/nhDY/oygIA=');
with Chart do
begin
OverviewVisible := EXG2ANTTLib_TLB.exOverviewShowAllVisible;
AllowOverviewZoom := EXG2ANTTLib_TLB.exAlwaysZoom;
Label[EXG2ANTTLib_TLB.exSecond] := '';
Label[EXG2ANTTLib_TLB.exYear] := '';
OutputDebugString( OverviewZoomCaption );
OverviewZoomCaption := 'Year|�Year|�Year|Month|Third|<img>1</img>|Day|Hour|Min|Sec';
end;
end
|
|
1373
|
How do I get it to only display Min, Hour, Day, Week , Month, ie remove Sec and Year in the overview area
with G2antt1 do
begin
	with Chart do
	begin
		OverviewVisible := EXG2ANTTLib_TLB.exOverviewShowAllVisible;
		AllowOverviewZoom := EXG2ANTTLib_TLB.exAlwaysZoom;
		Label[EXG2ANTTLib_TLB.exSecond] := '';
		Label[EXG2ANTTLib_TLB.exYear] := '';
	end;
end
|
|
1372
|
Is it possible to show quarter hours markers
with G2antt1 do
begin
	BeginUpdate();
	GridLineColor := RGB(0,0,0);
	VisualAppearance.Add(3,'gBFLBCJwBAEHhEJAEGg4BdMIQAAYAQGKIYBkAKBQAGaAoDDUNw5QwAAwjSKkEwsACEIrjKCRShyCYZRhGcTAFBMIhkGoSZKlCIRVDCKYJDbKACSFKkNQ7AabZBgOQJVg' +
	'OKovThKcIybQAASJCKRY7nUIIJA+SoDSRAbqhYIgASnKqLJAkACIJJAaRjHQdJxGKKMQANBghCZseKhWgkKIJUxAdLTWAAMQuaCoZ5icRAca2fJ+XzfeBYDgmAYNQbDc' +
	'JhHCMMwXDaJZBiGJ4dimI4rR7JIDzDJ8cxbEKTZ5meg5boGRZNTrMQA0fQ9MynK6vahfOi7DpuaZnWrcMb2fYNZwrGq0bxoW58BwmP5/XrkNa4XgcVgmAUBA');
	HeaderHeight := 20;
	with Chart do
	begin
		FirstVisibleDate := '1/1/2001';
		PaneWidth[False] := 0;
		LevelCount := 2;
		UnitScale := EXG2ANTTLib_TLB.exHour;
		with Level[0] do
		begin
			Alignment := EXG2ANTTLib_TLB.exHOutside;
			Label := '<%dddd%>, <%mmmm%> <b><%d%></b>, <%yyyy%>';
			DrawTickLines := EXG2ANTTLib_TLB.exLevelSolidLine;
		end;
		with Level[1] do
		begin
			Label := '<%hh%>:00';
			BackColor := $3000000;
			DrawTickLines := EXG2ANTTLib_TLB.exLevelSolidLine;
		end;
		DrawLevelSeparator := EXG2ANTTLib_TLB.exLevelSolidLine;
		UnitWidth := 64;
		ResizeUnitScale := EXG2ANTTLib_TLB.exMinute;
		ResizeUnitCount := 15;
	end;
	EndUpdate();
end
|
|
1371
|
How can I ensure or always show the labels on the chart part, when scrolling the chart to left or right
with G2antt1 do
begin
	BeginUpdate();
	with Chart do
	begin
		FirstVisibleDate := '1/1/2001';
		PaneWidth[False] := 0;
		LevelCount := 2;
		UnitWidth := 48;
		UnitScale := EXG2ANTTLib_TLB.exHour;
		with Level[0] do
		begin
			Alignment := Integer(EXG2ANTTLib_TLB.exHOutside) Or Integer(EXG2ANTTLib_TLB.CenterAlignment);
			Label := '<%dddd%>, <%mmmm%> <b><%d%></b>, <%yyyy%>';
		end;
		Level[1].Label := '<%hh%>:00';
	end;
	EndUpdate();
end
|
|
1370
|
I associate the Start and End columns with bars, but some of them are not shown. What am I doing wrong
with G2antt1 do
begin
	BeginUpdate();
	MarkSearchColumn := False;
	Items.AllowCellValueToItemBar := True;
	with Chart do
	begin
		LevelCount := 2;
		FirstVisibleDate := '12/25/2000';
		PaneWidth[False] := 128;
	end;
	with (IUnknown(Columns.Add('Start')) as EXG2ANTTLib_TLB.Column) do
	begin
		Def[EXG2ANTTLib_TLB.exCellValueToItemBarProperty] := OleVariant(1);
		Def[EXG2ANTTLib_TLB.exCellValueToItemBarKey] := 'K1';
	end;
	with (IUnknown(Columns.Add('End')) as EXG2ANTTLib_TLB.Column) do
	begin
		Def[EXG2ANTTLib_TLB.exCellValueToItemBarProperty] := OleVariant(2);
		Def[EXG2ANTTLib_TLB.exCellValueToItemBarKey] := 'K1';
	end;
	with Items do
	begin
		AddBar(AddItem(Null),'Task','1/1/2001','1/5/2001','K1',Null);
		AddBar(AddItem(Null),'Task','1/2/2001','1/6/2001','K1',Null);
		AddBar(AddItem(Null),'Task','1/3/2001','1/7/2001','????','????');
	end;
	EndUpdate();
end
|
|
1369
|
How can I implement OLE Drag and Drop operation
// OLEStartDrag event - Occurs when the OLEDrag method is called.
procedure TForm1.G2antt1OLEStartDrag(ASender: TObject; Data : IExDataObject; var AllowedEffects : Integer);
begin
	// Data.SetData("your data to drag")
	with G2antt1 do
	begin
		AllowedEffects := 2;
	end
end;

with G2antt1 do
begin
	BeginUpdate();
	Chart.PaneWidth[True] := 0;
	Columns.Add('Default');
	with Items do
	begin
		AddItem('Item 1');
		AddItem('Item 2');
		AddItem('Item 3');
		AddItem('Item 4');
		AddItem('Item 5');
	end;
	OLEDropMode := EXG2ANTTLib_TLB.exOLEDropManual;
	EndUpdate();
end
|
|
1368
|
I can not associate the bar's start and end properties with my start/end columns, only if the bar's key is empty or null. What can I do
// ButtonClick event - Occurs when user clicks on the cell's button.
procedure TForm1.G2antt1ButtonClick(ASender: TObject; Item : HITEM; ColIndex : Integer; Key : OleVariant);
begin
	with G2antt1 do
	begin
		BeginUpdate();
		with Columns do
		begin
			Item['Tasks'].Def[EXG2ANTTLib_TLB.exCellValueToItemBarKey] := 'B';
			Item['Start'].Def[EXG2ANTTLib_TLB.exCellValueToItemBarKey] := 'B';
			Item['End'].Def[EXG2ANTTLib_TLB.exCellValueToItemBarKey] := 'B';
		end;
		with Items do
		begin
			CellValue[OleVariant(Item),OleVariant(1)] := 'B';
			ItemBar[0,'B',EXG2ANTTLib_TLB.exBarColor] := OleVariant(0);
			ItemBar[0,'A',EXG2ANTTLib_TLB.exBarColor] := OleVariant(16775408);
		end;
		EndUpdate();
	end
end;

with G2antt1 do
begin
	BeginUpdate();
	with Columns do
	begin
		with (IUnknown(Add('Tasks')) as EXG2ANTTLib_TLB.Column) do
		begin
			Width := 32;
			Def[EXG2ANTTLib_TLB.exCellValueToItemBarProperty] := OleVariant(3);
			Def[EXG2ANTTLib_TLB.exCellValueToItemBarKey] := 'A';
		end;
		with (IUnknown(Add('Start')) as EXG2ANTTLib_TLB.Column) do
		begin
			Def[EXG2ANTTLib_TLB.exCellValueToItemBarProperty] := OleVariant(1);
			Def[EXG2ANTTLib_TLB.exCellValueToItemBarKey] := 'A';
			Editor.EditType := EXG2ANTTLib_TLB.DateType;
		end;
		with (IUnknown(Add('End')) as EXG2ANTTLib_TLB.Column) do
		begin
			Def[EXG2ANTTLib_TLB.exCellValueToItemBarProperty] := OleVariant(2);
			Def[EXG2ANTTLib_TLB.exCellValueToItemBarKey] := 'A';
			Editor.EditType := EXG2ANTTLib_TLB.DateType;
		end;
	end;
	with Chart do
	begin
		FirstVisibleDate := '9/20/2006';
		AllowLinkBars := True;
		AllowCreateBar := EXG2ANTTLib_TLB.exNoCreateBar;
		LevelCount := 2;
		PaneWidth[False] := 196;
		with Bars.Item['Task'] do
		begin
			Pattern := EXG2ANTTLib_TLB.exPatternBDiagonal;
			OverlaidType := Integer(EXG2ANTTLib_TLB.exOverlaidBarsStackAutoArrange) Or Integer(EXG2ANTTLib_TLB.exOverlaidBarsStack);
			Overlaid[EXG2ANTTLib_TLB.exOverlaidBarsTransparent] := OleVariant(80);
		end;
	end;
	with Items do
	begin
		LockedItemCount[EXG2ANTTLib_TLB.exTop] := 1;
		h := LockedItem[EXG2ANTTLib_TLB.exTop,0];
		CellValue[OleVariant(h),OleVariant(0)] := 'Select';
		CellHasButton[OleVariant(h),OleVariant(0)] := True;
		CellMerge[OleVariant(h),OleVariant(1)] := OleVariant(2);
		CellValue[OleVariant(h),OleVariant(1)] := 'A';
		CellEditor[OleVariant(h),OleVariant(1)].EditType := EXG2ANTTLib_TLB.EditType;
	end;
	with Items do
	begin
		AllowCellValueToItemBar := True;
		h := AddItem('Task 1');
		AddBar(h,'Task','9/21/2006','9/24/2006','A','A');
		AddBar(h,'Task','9/25/2006','9/28/2006','B','B');
		ItemBar[h,'B',EXG2ANTTLib_TLB.exBarColor] := OleVariant(16775408);
		h := AddItem('Task 2');
		AddBar(h,'Task','9/22/2006','9/25/2006','A','A');
		AddBar(h,'Task','9/26/2006','9/29/2006','B','B');
		ItemBar[h,'B',EXG2ANTTLib_TLB.exBarColor] := OleVariant(16775408);
	end;
	EndUpdate();
end
|
|
1367
|
How can I determine the order of the events
// AddLink event - Occurs when the user links two bars using the mouse.
procedure TForm1.G2antt1AddLink(ASender: TObject; LinkKey : WideString);
begin
with G2antt1 do
begin
OutputDebugString( 'AddLink' );
OutputDebugString( LinkKey );
end
end;
// AfterExpandItem event - Fired after an item is expanded (collapsed).
procedure TForm1.G2antt1AfterExpandItem(ASender: TObject; Item : HITEM);
begin
with G2antt1 do
begin
OutputDebugString( 'AfterExpandItem' );
OutputDebugString( Item );
end
end;
// AllowLink event - Notifies at runtime when a link between two bars is possible.
procedure TForm1.G2antt1AllowLink(ASender: TObject; StartItem : HITEM; StartBarKey : OleVariant; EndItem : HITEM; EndBarKey : OleVariant; var LinkKey : OleVariant; var Cancel : WordBool);
begin
with G2antt1 do
begin
OutputDebugString( 'AllowLink' );
OutputDebugString( StartItem );
OutputDebugString( StartBarKey );
OutputDebugString( EndItem );
OutputDebugString( EndBarKey );
OutputDebugString( LinkKey );
end
end;
// AnchorClick event - Occurs when an anchor element is clicked.
procedure TForm1.G2antt1AnchorClick(ASender: TObject; AnchorID : WideString; Options : WideString);
begin
with G2antt1 do
begin
OutputDebugString( 'AnchorClick' );
OutputDebugString( AnchorID );
OutputDebugString( Options );
end
end;
// BarParentChange event - Occurs just before moving a bar from current item to another item.
procedure TForm1.G2antt1BarParentChange(ASender: TObject; Item : HITEM; Key : OleVariant; NewItem : HITEM; var Cancel : WordBool);
begin
with G2antt1 do
begin
OutputDebugString( 'BarParentChange' );
OutputDebugString( Item );
OutputDebugString( Key );
OutputDebugString( NewItem );
end
end;
// BarResize event - Occurs when a bar is moved or resized.
procedure TForm1.G2antt1BarResize(ASender: TObject; Item : HITEM; Key : OleVariant);
begin
with G2antt1 do
begin
OutputDebugString( 'BarResize' );
OutputDebugString( Item );
OutputDebugString( Key );
end
end;
// BarResizing event - Occurs when a bar is moving or resizing.
procedure TForm1.G2antt1BarResizing(ASender: TObject; Item : HITEM; Key : OleVariant);
begin
with G2antt1 do
begin
OutputDebugString( 'BarResizing' );
OutputDebugString( Item );
OutputDebugString( Key );
end
end;
// BeforeExpandItem event - Fired before an item is about to be expanded (collapsed).
procedure TForm1.G2antt1BeforeExpandItem(ASender: TObject; Item : HITEM; var Cancel : OleVariant);
begin
with G2antt1 do
begin
OutputDebugString( 'BeforeExpandItem' );
OutputDebugString( Item );
end
end;
// ButtonClick event - Occurs when user clicks on the cell's button.
procedure TForm1.G2antt1ButtonClick(ASender: TObject; Item : HITEM; ColIndex : Integer; Key : OleVariant);
begin
with G2antt1 do
begin
OutputDebugString( 'ButtonClick' );
OutputDebugString( Item );
OutputDebugString( ColIndex );
OutputDebugString( Key );
end
end;
// CellImageClick event - Fired after the user clicks on the image's cell area.
procedure TForm1.G2antt1CellImageClick(ASender: TObject; Item : HITEM; ColIndex : Integer);
begin
with G2antt1 do
begin
OutputDebugString( 'CellImageClick' );
OutputDebugString( Item );
OutputDebugString( ColIndex );
end
end;
// CellStateChanged event - Fired after cell's state has been changed.
procedure TForm1.G2antt1CellStateChanged(ASender: TObject; Item : HITEM; ColIndex : Integer);
begin
with G2antt1 do
begin
OutputDebugString( 'CellStateChanged' );
OutputDebugString( Item );
OutputDebugString( ColIndex );
end
end;
// Change event - Occurs when the user changes the cell's content.
procedure TForm1.G2antt1Change(ASender: TObject; Item : HITEM; ColIndex : Integer; var NewValue : OleVariant);
begin
with G2antt1 do
begin
OutputDebugString( 'Change' );
OutputDebugString( Item );
OutputDebugString( ColIndex );
OutputDebugString( NewValue );
end
end;
// ChartEndChanging event - Occurs after the chart has been changed.
procedure TForm1.G2antt1ChartEndChanging(ASender: TObject; Operation : BarOperationEnum);
begin
with G2antt1 do
begin
OutputDebugString( 'ChartEndChanging' );
OutputDebugString( Operation );
end
end;
// ChartSelectionChanged event - Occurs when the user selects objects in the chart area.
procedure TForm1.G2antt1ChartSelectionChanged(ASender: TObject; );
begin
with G2antt1 do
begin
OutputDebugString( 'ChartSelectionChanged' );
end
end;
// ChartStartChanging event - Occurs when the chart is about to be changed.
procedure TForm1.G2antt1ChartStartChanging(ASender: TObject; Operation : BarOperationEnum);
begin
with G2antt1 do
begin
OutputDebugString( 'ChartStartChanging' );
OutputDebugString( Operation );
end
end;
// Click event - Occurs when the user presses and then releases the left mouse button over the tree control.
procedure TForm1.G2antt1Click(ASender: TObject; );
begin
with G2antt1 do
begin
OutputDebugString( 'Click' );
end
end;
// ColumnClick event - Fired after the user clicks on column's header.
procedure TForm1.G2antt1ColumnClick(ASender: TObject; Column : IColumn);
begin
with G2antt1 do
begin
OutputDebugString( 'ColumnClick' );
end
end;
// CreateBar event - Fired when the user creates a new bar.
procedure TForm1.G2antt1CreateBar(ASender: TObject; Item : HITEM; DateStart : TDateTime; DateEnd : TDateTime);
begin
with G2antt1 do
begin
OutputDebugString( 'CreateBar' );
OutputDebugString( Item );
OutputDebugString( DateStart );
OutputDebugString( DateEnd );
end
end;
// DateChange event - Occurs when the first visible date is changed.
procedure TForm1.G2antt1DateChange(ASender: TObject; );
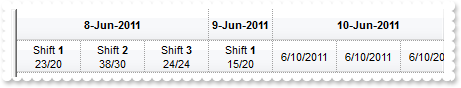
begin
with G2antt1 do
begin
OutputDebugString( 'DateChange' );
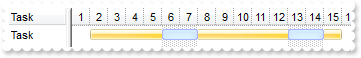
end
end;
// DblClick event - Occurs when the user dblclk the left mouse button over an object.
procedure TForm1.G2antt1DblClick(ASender: TObject; Shift : Smallint; X : Integer; Y : Integer);
begin
with G2antt1 do
begin
OutputDebugString( 'DblClick' );
OutputDebugString( Shift );
OutputDebugString( X );
OutputDebugString( Y );
Edit(Null);
end
end;
// Edit event - Occurs just before editing the focused cell.
procedure TForm1.G2antt1Edit(ASender: TObject; Item : HITEM; ColIndex : Integer; var Cancel : WordBool);
begin
with G2antt1 do
begin
OutputDebugString( 'Edit' );
OutputDebugString( Item );
OutputDebugString( ColIndex );
end
end;
// EditClose event - Occurs when the edit operation ends.
procedure TForm1.G2antt1EditClose(ASender: TObject; );
begin
with G2antt1 do
begin
OutputDebugString( 'EditClose' );
end
end;
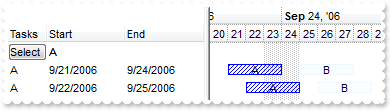
// EditOpen event - Occurs when the edit operation starts.
procedure TForm1.G2antt1EditOpen(ASender: TObject; );
begin
with G2antt1 do
begin
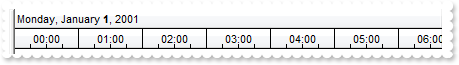
OutputDebugString( 'EditOpen' );
end
end;
// FilterChange event - Occurs when the filter was changed.
procedure TForm1.G2antt1FilterChange(ASender: TObject; );
begin
with G2antt1 do
begin
OutputDebugString( 'FilterChange' );
end
end;
// FilterChanging event - Notifies your application that the filter is about to change.
procedure TForm1.G2antt1FilterChanging(ASender: TObject; );
begin
with G2antt1 do
begin
OutputDebugString( 'FilterChanging' );
end
end;
// FocusChanged event - Occurs when a cell gets the focus.
procedure TForm1.G2antt1FocusChanged(ASender: TObject; );
begin
with G2antt1 do
begin
OutputDebugString( 'FocusChanged' );
end
end;
// InsideZoom event - Notifies your application that a date is about to be magnified.
procedure TForm1.G2antt1InsideZoom(ASender: TObject; DateTime : TDateTime);
begin
with G2antt1 do
begin
OutputDebugString( 'InsideZoom' );
OutputDebugString( DateTime );
end
end;
// KeyDown event - Occurs when the user presses a key while an object has the focus.
procedure TForm1.G2antt1KeyDown(ASender: TObject; var KeyCode : Smallint; Shift : Smallint);
begin
with G2antt1 do
begin
OutputDebugString( 'KeyDown' );
OutputDebugString( KeyCode );
OutputDebugString( Shift );
end
end;
// KeyPress event - Occurs when the user presses and releases an ANSI key.
procedure TForm1.G2antt1KeyPress(ASender: TObject; var KeyAscii : Smallint);
begin
with G2antt1 do
begin
OutputDebugString( 'KeyPress' );
OutputDebugString( KeyAscii );
end
end;
// KeyUp event - Occurs when the user releases a key while an object has the focus.
procedure TForm1.G2antt1KeyUp(ASender: TObject; var KeyCode : Smallint; Shift : Smallint);
begin
with G2antt1 do
begin
OutputDebugString( 'KeyUp' );
OutputDebugString( KeyCode );
OutputDebugString( Shift );
end
end;
// LayoutChanged event - Occurs when column's position or column's size is changed.
procedure TForm1.G2antt1LayoutChanged(ASender: TObject; );
begin
with G2antt1 do
begin
OutputDebugString( 'LayoutChanged' );
end
end;
// MouseDown event - Occurs when the user presses a mouse button.
procedure TForm1.G2antt1MouseDown(ASender: TObject; Button : Smallint; Shift : Smallint; X : Integer; Y : Integer);
begin
with G2antt1 do
begin
OutputDebugString( 'MouseDown' );
OutputDebugString( Button );
OutputDebugString( Shift );
OutputDebugString( X );
OutputDebugString( Y );
end
end;
// MouseMove event - Occurs when the user moves the mouse.
procedure TForm1.G2antt1MouseMove(ASender: TObject; Button : Smallint; Shift : Smallint; X : Integer; Y : Integer);
begin
end;
// MouseUp event - Occurs when the user releases a mouse button.
procedure TForm1.G2antt1MouseUp(ASender: TObject; Button : Smallint; Shift : Smallint; X : Integer; Y : Integer);
begin
with G2antt1 do
begin
OutputDebugString( 'MouseUp' );
OutputDebugString( Button );
OutputDebugString( Shift );
OutputDebugString( X );
OutputDebugString( Y );
end
end;
// OffsetChanged event - Occurs when the scroll position has been changed.
procedure TForm1.G2antt1OffsetChanged(ASender: TObject; Horizontal : WordBool; NewVal : Integer);
begin
with G2antt1 do
begin
OutputDebugString( 'OffsetChanged' );
OutputDebugString( Horizontal );
OutputDebugString( NewVal );
end
end;
// OversizeChanged event - Occurs when the right range of the scroll has been changed.
procedure TForm1.G2antt1OversizeChanged(ASender: TObject; Horizontal : WordBool; NewVal : Integer);
begin
with G2antt1 do
begin
OutputDebugString( 'OversizeChanged' );
OutputDebugString( Horizontal );
OutputDebugString( NewVal );
end
end;
// OverviewZoom event - Occurs once the user selects a new time scale unit in the overview zoom area.
procedure TForm1.G2antt1OverviewZoom(ASender: TObject; );
begin
with G2antt1 do
begin
OutputDebugString( 'OverviewZoom' );
end
end;
// RClick event - Fired when right mouse button is clicked
procedure TForm1.G2antt1RClick(ASender: TObject; );
begin
with G2antt1 do
begin
OutputDebugString( 'RClick' );
end
end;
// ScrollButtonClick event - Occurs when the user clicks a button in the scrollbar.
procedure TForm1.G2antt1ScrollButtonClick(ASender: TObject; ScrollBar : ScrollBarEnum; ScrollPart : ScrollPartEnum);
begin
with G2antt1 do
begin
OutputDebugString( 'ScrollButtonClick' );
OutputDebugString( ScrollBar );
OutputDebugString( ScrollPart );
end
end;
// SelectionChanged event - Fired after a new item has been selected.
procedure TForm1.G2antt1SelectionChanged(ASender: TObject; );
begin
with G2antt1 do
begin
OutputDebugString( 'SelectionChanged' );
end
end;
// Sort event - Fired when the control sorts a column.
procedure TForm1.G2antt1Sort(ASender: TObject; );
begin
with G2antt1 do
begin
OutputDebugString( 'Sort' );
end
end;
with G2antt1 do
begin
BeginUpdate();
Images('gBJJgBAIDAAGAAEAAQhYAf8Pf4hh0QihCJo2AEZjQAjEZFEaIEaEEaAIAkcbk0olUrlktl0vmExmUzmk1m03nE5nU7nk9n0/oFBoVDolFo1HpFJpVLplNp1PqFRqVTql' +
'Vq1XrFZrVbrldr1fsFhsVjslls1ntFptVrtltt1vuFxuVzul1u13vF5vV7vl9v1/wGBwWDwmFw2HxGJxWLxmNx0xiFdyOTh8Tf9ZymXx+QytcyNgz8r0OblWjyWds+m0' +
'ka1Vf1ta1+r1mos2xrG2xeZ0+a0W0qOx3GO4NV3WeyvD2XJ5XL5nN51aiw+lfSj0gkUkAEllHanHI5j/cHg8EZf7w8vl8j4f/qfEZeB09/vjLAB30+kZQAP/P5/H6/yN' +
'AOAEAwCjMBwFAEDwJBMDwLBYAP2/8Hv8/gAGAD8LQs9w/nhDY/oygIA=');
DrawGridLines := EXG2ANTTLib_TLB.exAllLines;
LinesAtRoot := EXG2ANTTLib_TLB.exLinesAtRoot;
GridLineStyle := EXG2ANTTLib_TLB.exGridLinesHDash;
AutoEdit := False;
ExpandOnDblClick := False;
with Chart do
begin
AllowInsideZoom := True;
OverviewVisible := EXG2ANTTLib_TLB.exOverviewShowAllVisible;
AllowOverviewZoom := EXG2ANTTLib_TLB.exAlwaysZoom;
PaneWidth[False] := 128;
FirstVisibleDate := '1/1/2001';
DrawGridLines := EXG2ANTTLib_TLB.exAllLines;
GridLineStyle := Integer(EXG2ANTTLib_TLB.exGridLinesVSolid) Or Integer(EXG2ANTTLib_TLB.exGridLinesHDash);
LevelCount := 2;
Level[0].DrawGridLines := True;
Bars.Item['Task'].Pattern := EXG2ANTTLib_TLB.exPatternSolid;
UnitScale := EXG2ANTTLib_TLB.exDay;
Label[EXG2ANTTLib_TLB.exSecond] := '';
Label[EXG2ANTTLib_TLB.exMinute] := '';
Label[EXG2ANTTLib_TLB.exHour] := '';
end;
with Columns do
begin
with (IUnknown(Add('Column')) as EXG2ANTTLib_TLB.Column) do
begin
DisplayFilterButton := True;
Def[EXG2ANTTLib_TLB.exCellHasCheckBox] := OleVariant(True);
Editor.EditType := EXG2ANTTLib_TLB.EditType;
end;
with (IUnknown(Add('Button')) as EXG2ANTTLib_TLB.Column) do
begin
AllowSizing := False;
Width := 18;
Def[EXG2ANTTLib_TLB.exCellHasButton] := OleVariant(True);
end;
end;
with Items do
begin
h := AddItem('parent');
CellImage[OleVariant(h),OleVariant(0)] := 1;
AddBar(h,'Task','1/2/2001','1/5/2001','A','<a>A</a>');
ItemBar[h,'A',EXG2ANTTLib_TLB.exBarHAlignCaption] := OleVariant(18);
ItemBar[h,'A',EXG2ANTTLib_TLB.exBarCanMoveToAnother] := OleVariant(True);
ItemBar[h,'A',EXG2ANTTLib_TLB.exBarToolTip] := 'This is a bit of text that should be shown when cursor hovers the bar';
AddBar(h,'Task','1/8/2001','1/15/2001','B','<a>B</a>');
ItemBar[h,'B',EXG2ANTTLib_TLB.exBarHAlignCaption] := OleVariant(18);
ItemBar[h,'B',EXG2ANTTLib_TLB.exBarCanMoveToAnother] := OleVariant(True);
InsertItem(h,'','child');
ExpandItem[h] := True;
end;
EndUpdate();
end
|
|
1366
|
How can I change the chart's horizontal grid lines
with G2antt1 do
begin
	BeginUpdate();
	DrawGridLines := EXG2ANTTLib_TLB.exAllLines;
	GridLineStyle := EXG2ANTTLib_TLB.exGridLinesHDash;
	with Chart do
	begin
		PaneWidth[False] := 48;
		FirstVisibleDate := '1/1/2001';
		DrawGridLines := EXG2ANTTLib_TLB.exAllLines;
		GridLineStyle := Integer(EXG2ANTTLib_TLB.exGridLinesVSolid) Or Integer(EXG2ANTTLib_TLB.exGridLinesHDash);
		LevelCount := 2;
		Level[0].DrawGridLines := True;
		Bars.Item['Task'].Pattern := EXG2ANTTLib_TLB.exPatternSolid;
	end;
	Columns.Add('Column');
	with Items do
	begin
		h := AddItem('Item 1');
		AddBar(h,'Task','1/2/2001','1/5/2001','A',Null);
		AddBar(h,'Task','1/8/2001','1/15/2001','B',Null);
	end;
	EndUpdate();
end
|
|
1365
|
Is there any way to determine whether the ADO operations fails
// AddItem event - Occurs after a new Item has been inserted to Items collection.
procedure TForm1.G2antt1AddItem(ASender: TObject; Item : HITEM);
begin
	with G2antt1 do
	begin
		with Items do
		begin
			AddBar(Item,'Task',CellValue[OleVariant(Item),OleVariant(2)],CellValue[OleVariant(Item),OleVariant(4)],Null,Null);
		end;
	end
end;

// Error event - Fired when an internal error occurs.
procedure TForm1.G2antt1Error(ASender: TObject; Error : Integer; Description : WideString);
begin
	with G2antt1 do
	begin
		OutputDebugString( Error );
		OutputDebugString( Description );
	end
end;

with G2antt1 do
begin
	BeginUpdate();
	with Chart do
	begin
		FirstVisibleDate := '8/3/1994';
		PaneWidth[False] := 256;
		LevelCount := 2;
		UnitScale := EXG2ANTTLib_TLB.exDay;
		FirstWeekDay := EXG2ANTTLib_TLB.exMonday;
		OverviewVisible := EXG2ANTTLib_TLB.exOverviewShowAllVisible;
	end;
	ColumnAutoResize := False;
	ContinueColumnScroll := False;
	rs := (IUnknown(ComObj.CreateComObject(ComObj.ProgIDToClassID('ADOR.Recordset'))) as ADODB_TLB.Recordset);
	with rs do
	begin
		Open('Orders','Provider=Microsoft.ACE.OLEDB.12.0;Data Source=C:\Program Files\Exontrol\ExG2antt\Sample\Access\misc.accdb',1,1,Null);
	end;
	DataSource := (IUnknown(rs) as ADODB_TLB.Recordset);
	Items.AllowCellValueToItemBar := True;
	Columns.Item[OleVariant(2)].Def[EXG2ANTTLib_TLB.exCellValueToItemBarProperty] := OleVariant(1);
	Columns.Item[OleVariant(4)].Def[EXG2ANTTLib_TLB.exCellValueToItemBarProperty] := OleVariant(2);
	EndUpdate();
end
|
|
1364
|
Is it possible to select a column instead sorting it
// ColumnClick event - Fired after the user clicks on column's header.
procedure TForm1.G2antt1ColumnClick(ASender: TObject; Column : IColumn);
begin
	// Column.Selected = True
	with G2antt1 do
	begin
		BeginUpdate();
		Columns.Item[OleVariant(0)].Selected := False;
		Columns.Item[OleVariant(1)].Selected := False;
		Items.SelectAll();
		EndUpdate();
	end
end;

with G2antt1 do
begin
	BeginUpdate();
	MarkSearchColumn := False;
	ShowFocusRect := False;
	SingleSel := False;
	FullRowSelect := EXG2ANTTLib_TLB.exRectSel;
	SortOnClick := EXG2ANTTLib_TLB.exNoSort;
	with Columns do
	begin
		Add('Column1');
		Add('Column2');
	end;
	with Items do
	begin
		CellValue[OleVariant(AddItem('One')),OleVariant(1)] := 'Three';
		CellValue[OleVariant(AddItem('Two')),OleVariant(1)] := 'Four';
		SelectAll();
	end;
	EndUpdate();
end
|
|
1363
|
I am using the exRectSel, and clicking the first column, has no effect, instead if I click other it works as it should
with G2antt1 do
begin
	BeginUpdate();
	SearchColumnIndex := -1;
	FullRowSelect := EXG2ANTTLib_TLB.exRectSel;
	ShowFocusRect := False;
	MarkSearchColumn := False;
	with Columns do
	begin
		Add('Column1');
		Add('Column2');
	end;
	with Items do
	begin
		CellValue[OleVariant(AddItem(OleVariant(1))),OleVariant(1)] := OleVariant(2);
		CellValue[OleVariant(AddItem(OleVariant(3))),OleVariant(1)] := OleVariant(4);
		CellValue[OleVariant(AddItem(OleVariant(5))),OleVariant(1)] := OleVariant(6);
	end;
	EndUpdate();
end
|
|
1362
|
Is it possible to display empty strings for 0 values
with G2antt1 do
begin
	with (IUnknown(Columns.Add('Currency')) as EXG2ANTTLib_TLB.Column) do
	begin
		FormatColumn := 'dbl(value) ? currency(dbl(value)) : ``';
		with Editor do
		begin
			EditType := EXG2ANTTLib_TLB.EditType;
			Numeric := EXG2ANTTLib_TLB.exFloat;
		end;
	end;
	with Items do
	begin
		AddItem(OleVariant(1.23));
		AddItem(OleVariant(2.34));
		AddItem(OleVariant(0));
		AddItem(OleVariant(10000.99));
	end;
end
|
|
1361
|
Is it possible to display empty strings for 0 values
with G2antt1 do
begin
	Columns.Add('Number');
	(IUnknown(Columns.Add('Currency')) as EXG2ANTTLib_TLB.Column).ComputedField := '%0 ? currency(%0) : ``';
	with Items do
	begin
		AddItem(OleVariant(1.23));
		AddItem(OleVariant(2.34));
		AddItem(OleVariant(0));
		AddItem(OleVariant(10000.99));
	end;
end
|
|
1360
|
How can I hide a date from the chart view, when I display hours instead days
with G2antt1 do
begin
	BeginUpdate();
	HeaderHeight := 32;
	with Chart do
	begin
		FirstVisibleDate := '6/8/2011';
		AdjustLevelsToBase := True;
		PaneWidth[False] := 0;
		LevelCount := 2;
		AllowInsideZoom := True;
		with Level[0] do
		begin
			Alignment := EXG2ANTTLib_TLB.CenterAlignment;
			Label := '<b><%d%>-<%mmm%>-<%yyyy%>';
			Unit := EXG2ANTTLib_TLB.exDay;
		end;
		with Level[1] do
		begin
			Label := '<%h%>';
			Count := 8;
			Unit := EXG2ANTTLib_TLB.exHour;
			FormatLabel := 'date(int(dvalue)) case (#06/08/2011# : (int(value) case ( 0 : ''Shift <b>1</b><br>23/20''; 8 : ''Shift <b>2</b><br>38/30'' ; 16 : ''S' +
	'hift <b>3</b><br>24/24'' ) ) ; #06/09/2011# : (int(value) case ( 0 : ''Shift <b>1</b><br>15/20''; 8 : ''Shift <b>2</b><br>30/32'' ; 1' +
	'6 : ''Shift <b>3</b><br>26/24'' ) ) )';
		end;
		UnitWidth := 64;
		NonworkingDays := 0;
		AllowInsideZoom := True;
		DefaultInsideZoomFormat.InsideUnit := EXG2ANTTLib_TLB.exMinute;
		AllowResizeInsideZoom := False;
		InsideZoomOnDblClick := False;
		with InsideZooms do
		begin
			SplitBaseLevel := False;
			DefaultWidth := 0;
		end;
		with InsideZooms do
		begin
			Add('6/9/2011 8:00:00 AM');
			Add('6/9/2011 4:00:00 PM');
		end;
	end;
	EndUpdate();
end
|
|
1359
|
I�ve created a skin (EBN) for the bars of my chart, with rounded top corners. The problem, is that these rounded corners are applied also at beginning and the end of the non working units. Is it possible to show a different picture/skin for the non-working part of the bars
with G2antt1 do
begin
	BeginUpdate();
	VisualAppearance.Add(1,'c:\exontrol\images\normal.ebn');
	VisualAppearance.Add(2,'c:\exontrol\images\pushed.ebn');
	Columns.Add('Task');
	Chart.PaneWidth[False] := 128;
	with Chart.Bars do
	begin
		Item['Task'].Color := $1000000;
		Item['Split'].Color := $2000000;
		Add('Task:Split').Shortcut := 'TS';
	end;
	Chart.FirstVisibleDate := '1/1/2001';
	with Items do
	begin
		AddBar(AddItem('Task'),'TS','1/2/2001','1/16/2001',Null,Null);
	end;
	EndUpdate();
end
|
|
1358
|
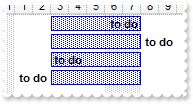
How do I display the names of the tasks on bars but not in the middle of the bar (left or right)
with G2antt1 do
begin
	BeginUpdate();
	Columns.Add('Tasks');
	with Chart do
	begin
		FirstVisibleDate := '12/27/2000';
		PaneWidth[False] := 128;
		with Bars.Item['Task'] do
		begin
			Pattern := EXG2ANTTLib_TLB.exPatternDot;
			Height := 15;
		end;
	end;
	with Items do
	begin
		h := AddItem('Task 1');
		AddBar(h,'Task','1/3/2001','1/8/2001','K1','<b>to do</b> ');
		ItemBar[h,'K1',EXG2ANTTLib_TLB.exBarHAlignCaption] := OleVariant(2);
		h := AddItem('Task 2');
		AddBar(h,'Task','1/3/2001','1/8/2001','K2','<b>to do</b>');
		ItemBar[h,'K2',EXG2ANTTLib_TLB.exBarHAlignCaption] := OleVariant(18);
		h := AddItem('Task 3');
		AddBar(h,'Task','1/3/2001','1/8/2001','K1',' <b>to do</b>');
		ItemBar[h,'K1',EXG2ANTTLib_TLB.exBarHAlignCaption] := OleVariant(0);
		h := AddItem('Task 4');
		AddBar(h,'Task','1/3/2001','1/8/2001','K2','<b>to do</b>');
		ItemBar[h,'K2',EXG2ANTTLib_TLB.exBarHAlignCaption] := OleVariant(16);
	end;
	EndUpdate();
end
|
|
1357
|
How can I get the list of items as they are displayed
with G2antt1 do
begin
BeginUpdate();
BackColorAlternate := RGB(240,240,240);
Columns.Add('Names');
with Items do
begin
AddItem('Mantel');
AddItem('Mechanik');
AddItem('Motor');
AddItem('Murks');
AddItem('M�rchen');
AddItem('M�hren');
AddItem('M�hle');
end;
Columns.Item[OleVariant(0)].SortOrder := EXG2ANTTLib_TLB.SortAscending;
EndUpdate();
OutputDebugString( GetItems(OleVariant(1)) );
end
|
|
1356
|
How can I disable the left and right arrows to move to next cell while editing
with G2antt1 do
begin
	var_Editor := (IUnknown(Columns.Add('Edit')) as EXG2ANTTLib_TLB.Column).Editor;
	with var_Editor do
	begin
		EditType := EXG2ANTTLib_TLB.EditType;
		Option[EXG2ANTTLib_TLB.exLeftArrow] := OleVariant(0);
		Option[EXG2ANTTLib_TLB.exRightArrow] := OleVariant(0);
	end;
	with Items do
	begin
		AddItem('Cell 1');
		AddItem('Cell 2');
		AddItem('Cell 3');
	end;
end
|
|
1355
|
Is it possible to define a bar that is treated as a non-working hour so user can move it at runtime
with G2antt1 do
begin
	BeginUpdate();
	with Chart do
	begin
		FirstVisibleDate := '1/1/2001';
		LevelCount := 2;
		PaneWidth[False] := 48;
		AllowNonworkingBars := True;
		Bars.Add('Task:Split').Shortcut := 'Task';
		UnitScale := EXG2ANTTLib_TLB.exHour;
		Level[1].Label := '<font ;4><%hh%>';
		UnitWidth := 12;
		NonworkingDaysPattern := EXG2ANTTLib_TLB.exPatternBDiagonal;
		NonworkingDays := 0;
	end;
	Columns.Add('Tasks');
	with Items do
	begin
		h := AddItem('Machine');
		ItemNonworkingUnits[h,OleVariant(False)] := '0';
		AddBar(h,'','1/1/2001 9:00:00 AM','1/1/2001 11:00:00 AM','A','pause');
		ItemBar[h,'A',EXG2ANTTLib_TLB.exBarTreatAsNonworking] := OleVariant(True);
		AddBar(h,'Task','1/1/2001 12:00:00 PM','1/1/2001 5:00:00 PM','Z',Null);
		ItemBar[h,'Z',EXG2ANTTLib_TLB.exBarKeepWorkingCount] := OleVariant(True);
	end;
	EndUpdate();
end
|
|
1354
|
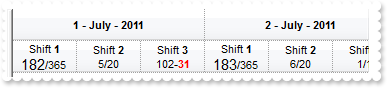
Is it possible to customize the chart's header so I can display shift and other values
with G2antt1 do
begin
	BeginUpdate();
	HeaderHeight := 32;
	with Chart do
	begin
		FirstVisibleDate := '6/8/2011';
		AdjustLevelsToBase := True;
		PaneWidth[False] := 0;
		LevelCount := 2;
		with Level[0] do
		begin
			Alignment := EXG2ANTTLib_TLB.CenterAlignment;
			Label := '<b><%d%> - <%mmmm%> - <%yyyy%>';
			Unit := EXG2ANTTLib_TLB.exDay;
		end;
		with Level[1] do
		begin
			Label := '<%h%>';
			Count := 8;
			Unit := EXG2ANTTLib_TLB.exHour;
			FormatLabel := 'date(int(dvalue)) case (#06/08/2011# : (int(value) case ( 0 : ''Shift <b>1</b><br>23/20''; 8 : ''Shift <b>2</b><br>38/30'' ; 16 : ''S' +
	'hift <b>3</b><br>24/24'' ) ) ; #06/09/2011# : (int(value) case ( 0 : ''Shift <b>1</b><br>15/20''; 8 : ''Shift <b>2</b><br>30/32'' ; 1' +
	'6 : ''Shift <b>3</b><br>26/24'' ) ) )';
		end;
		UnitWidth := 64;
		NonworkingDays := 0;
	end;
	EndUpdate();
end
|
|
1353
|
How can I change both start and end dates of the bar
with G2antt1 do
begin
	BeginUpdate();
	Columns.Add('Tasks');
	with Chart do
	begin
		PaneWidth[False] := 64;
		FirstVisibleDate := '6/19/2005';
	end;
	with Items do
	begin
		h := AddItem('Test');
		AddBar(h,'Task','6/22/2005','6/27/2005','t1',Null);
		AddBar(h,ItemBar[h,'t1',EXG2ANTTLib_TLB.exBarName],'6/21/2005','6/22/2005','t1',Null);
	end;
	EndUpdate();
end
|
|
1352
|
Is it possible to add new rows, as I type like in Excel
// EditClose event - Occurs when the edit operation ends.
procedure TForm1.G2antt1EditClose(ASender: TObject; );
begin
	with G2antt1 do
	begin
		Items.AddItem('');
	end
end;

with G2antt1 do
begin
	BeginUpdate();
	AutoEdit := True;
	(IUnknown(Columns.Add('Default')) as EXG2ANTTLib_TLB.Column).Editor.EditType := EXG2ANTTLib_TLB.EditType;
	FullRowSelect := EXG2ANTTLib_TLB.exColumnSel;
	Items.AddItem('');
	DrawGridLines := EXG2ANTTLib_TLB.exAllLines;
	ScrollBars := EXG2ANTTLib_TLB.exDisableBoth;
	EndUpdate();
end
|
|
1351
|
How do I load bars from my table/database
// AddItem event - Occurs after a new Item has been inserted to Items collection.
procedure TForm1.G2antt1AddItem(ASender: TObject; Item : HITEM);
begin
	with G2antt1 do
	begin
		with Items do
		begin
			AddBar(Item,'Task',CellValue[OleVariant(Item),OleVariant(2)],CellValue[OleVariant(Item),OleVariant(4)],Null,Null);
		end;
	end
end;

with G2antt1 do
begin
	BeginUpdate();
	with Chart do
	begin
		FirstVisibleDate := '8/3/1994';
		PaneWidth[False] := 256;
		LevelCount := 2;
		UnitScale := EXG2ANTTLib_TLB.exDay;
		FirstWeekDay := EXG2ANTTLib_TLB.exMonday;
		OverviewVisible := EXG2ANTTLib_TLB.exOverviewShowAllVisible;
	end;
	ColumnAutoResize := False;
	ContinueColumnScroll := False;
	rs := (IUnknown(ComObj.CreateComObject(ComObj.ProgIDToClassID('ADOR.Recordset'))) as ADODB_TLB.Recordset);
	with rs do
	begin
		Open('Orders','Provider=Microsoft.ACE.OLEDB.12.0;Data Source=C:\Program Files\Exontrol\ExG2antt\Sample\Access\misc.accdb',3,3,Null);
	end;
	DataSource := (IUnknown(rs) as ADODB_TLB.Recordset);
	Items.AllowCellValueToItemBar := True;
	Columns.Item[OleVariant(2)].Def[EXG2ANTTLib_TLB.exCellValueToItemBarProperty] := OleVariant(1);
	Columns.Item[OleVariant(4)].Def[EXG2ANTTLib_TLB.exCellValueToItemBarProperty] := OleVariant(2);
	EndUpdate();
end
|
|
1350
|
Is posible to reduce the size of the picture to be shown in the bar's caption
with G2antt1 do
begin
	BeginUpdate();
	HTMLPicture['pic1'] := 'c:\exontrol\images\zipdisk.gif';
	Columns.Add('Task');
	ScrollBySingleLine := True;
	with Chart do
	begin
		FirstVisibleDate := '1/1/2001';
		PaneWidth[False] := 78;
	end;
	with Items do
	begin
		h := AddItem('Default-Size');
		ItemHeight[h] := 48;
		AddBar(h,'Task','1/2/2001','1/6/2001','K1','<img>pic1</img>');
		h := AddItem('Custom-Size');
		AddBar(h,'Task','1/2/2001','1/6/2001','K2','<img>pic1:18</img>');
	end;
	EndUpdate();
end
|
|
1349
|
Is posible to reduce the size of the picture to be shown in the column's caption
with G2antt1 do
begin
	BeginUpdate();
	HTMLPicture['pic1'] := 'c:\exontrol\images\zipdisk.gif';
	HeaderHeight := 48;
	(IUnknown(Columns.Add('DefaultSize')) as EXG2ANTTLib_TLB.Column).HTMLCaption := 'Default-Size <img>pic1</img> Picture';
	(IUnknown(Columns.Add('CustomSize')) as EXG2ANTTLib_TLB.Column).HTMLCaption := 'Custom-Size <img>pic1:16</img> Picture';
	EndUpdate();
end
|
|
1348
|
Is it possible to display the selected dates using a solid color instead vertical lines
with G2antt1 do
begin
BeginUpdate();
with Chart do
begin
PaneWidth[False] := 128;
FirstVisibleDate := '1/1/2008';
MarkTodayColor := BackColor;
LevelCount := 2;
MarkSelectDateColor := $7fcbc0ff;
SelectLevel := 1;
SelectDate['1/8/2008'] := True;
SelectDate['1/9/2008'] := True;
SelectDate['1/10/2008'] := True;
end;
DefaultItemHeight := 72;
Columns.Add('Default');
with Items do
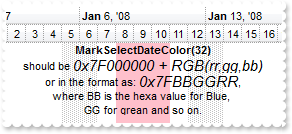
begin
AddBar(AddItem(''),'','1/7/2008','1/12/2008','','<b>MarkSelectDateColor(32)</b><br>should be <font ;11><i>0x7F000000 + RGB(rr,gg,bb)</i></font><br> or in the format as: <font ;1' +
'1><i>0x7FBBGGRR</i></font>, <br>where BB is the hexa value for Blue, <br>GG for grean and so on.');
end;
EndUpdate();
end
|
|
1347
|
How can I show the cells using a different background color based on the condition I have
with G2antt1 do
begin
	BeginUpdate();
	SelBackMode := EXG2ANTTLib_TLB.exTransparent;
	ShowFocusRect := False;
	with ConditionalFormats do
	begin
		with Add('dbl(%1)-dbl(%0) = 1',Null) do
		begin
			BackColor := $ff;
			ApplyTo := EXG2ANTTLib_TLB.FormatApplyToEnum($1);
		end;
		with Add('dbl(%0)-dbl(%1) = 3',Null) do
		begin
			BackColor := $ffff;
			ApplyTo := EXG2ANTTLib_TLB.exFormatToColumns;
		end;
		with Add('dbl(%1)-dbl(%0) = 4',Null) do
		begin
			ForeColor := $808080;
			Bold := True;
			ApplyTo := EXG2ANTTLib_TLB.exFormatToItems;
		end;
	end;
	with Columns do
	begin
		(IUnknown(Add('C1')) as EXG2ANTTLib_TLB.Column).Width := 8;
		(IUnknown(Add('C2')) as EXG2ANTTLib_TLB.Column).Width := 8;
		Add('');
	end;
	Chart.PaneWidth[True] := 0;
	with Items do
	begin
		CellValue[OleVariant(AddItem(OleVariant(2))),OleVariant(1)] := OleVariant(3);
		CellValue[OleVariant(AddItem(OleVariant(5))),OleVariant(1)] := OleVariant(2);
		CellValue[OleVariant(AddItem(OleVariant(5))),OleVariant(1)] := OleVariant(6);
		CellValue[OleVariant(AddItem(OleVariant(2))),OleVariant(1)] := OleVariant(6);
	end;
	EndUpdate();
end
|
|
1346
|
How can I specify the frame's color for all Task bars

with G2antt1 do
begin
	BeginUpdate();
	Columns.Add('Task');
	with Chart do
	begin
		FirstVisibleDate := '1/1/2001';
		PaneWidth[False] := 128;
		Bars.Item['Task'].Def[EXG2ANTTLib_TLB.exBarFrameColor] := OleVariant(255);
	end;
	with Items do
	begin
		AddBar(AddItem('Task 1'),'Task','1/2/2001','1/5/2001','K1',Null);
		AddBar(AddItem('Task 2'),'Task','1/2/2001','1/5/2001','K2',Null);
		AddBar(AddItem('Task 3'),'Task','1/2/2001','1/5/2001','K3',Null);
	end;
	EndUpdate();
end
|
|
1345
|
Is it possible to change the bar's frame color
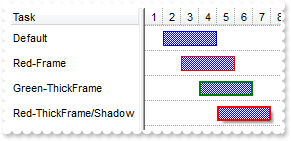
with G2antt1 do
begin
	BeginUpdate();
	DefaultItemHeight := 25;
	Columns.Add('Task');
	with Chart do
	begin
		FirstVisibleDate := '1/1/2001';
		PaneWidth[False] := 128;
		DrawGridLines := EXG2ANTTLib_TLB.exHLines;
		NonworkingDays := 0;
		Bars.Item['Task'].Height := 15;
	end;
	with Items do
	begin
		h := AddItem('Default');
		AddBar(h,'Task','1/2/2001','1/5/2001','K1',Null);
		h := AddItem('Red-Frame');
		AddBar(h,'Task','1/3/2001','1/6/2001','K1',Null);
		ItemBar[h,'K1',EXG2ANTTLib_TLB.exBarFrameColor] := OleVariant(255);
		h := AddItem('Green-ThickFrame');
		AddBar(h,'Task','1/4/2001','1/7/2001','K1',Null);
		ItemBar[h,'K1',EXG2ANTTLib_TLB.exBarPattern] := OleVariant(4099);
		ItemBar[h,'K1',EXG2ANTTLib_TLB.exBarFrameColor] := OleVariant(32768);
		h := AddItem('Red-ThickFrame/Shadow');
		AddBar(h,'Task','1/5/2001','1/8/2001','K1',Null);
		ItemBar[h,'K1',EXG2ANTTLib_TLB.exBarPattern] := OleVariant(12291);
		ItemBar[h,'K1',EXG2ANTTLib_TLB.exBarFrameColor] := OleVariant(255);
	end;
	EndUpdate();
end
|
|
1344
|
I need to customize the labels on the chart. Is it possible
with G2antt1 do
begin
	BeginUpdate();
	HeaderHeight := 32;
	with Chart do
	begin
		FirstVisibleDate := '7/1/2011';
		AdjustLevelsToBase := True;
		PaneWidth[False] := 0;
		LevelCount := 2;
		with Level[0] do
		begin
			Alignment := EXG2ANTTLib_TLB.CenterAlignment;
			Label := '<b><%d%> - <%mmmm%> - <%yyyy%>';
			Unit := EXG2ANTTLib_TLB.exDay;
		end;
		with Level[1] do
		begin
			Label := '<%h%>';
			Count := 8;
			Unit := EXG2ANTTLib_TLB.exHour;
			FormatLabel := 'int(value) case ( 0 : ''Shift <b>1</b><br><font ;11>'' + yearday(dvalue) + ''</font>/365 '' ; 8 : ''Shift <b>2</b><br>'' + weekday(dva' +
	'lue) + ''/20''; 16 : ''Shift <b>3</b><br>'' + (weekday(dvalue) case ( 0 : ''12/22''; 1 : ''12/23''; 2 : ''2/3''; 3 : ''12/13''; 4 : ''22/34'' ' +
	'; 5 : ''102-<fgcolor=FF0000><b>31</b></bgcolor>''; 6 : ''1/1'' ) )  ) ';
		end;
		UnitWidth := 64;
		NonworkingDays := 0;
	end;
	EndUpdate();
end
|
|
1343
|
Is it possible to show a frame around the bar
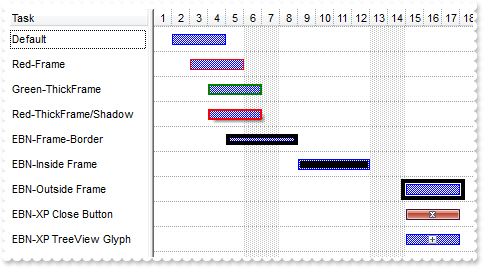
with G2antt1 do
begin
	BeginUpdate();
	DefaultItemHeight := 25;
	with VisualAppearance do
	begin
		Add(1,'gBFLBCJwBAEHhEJAEGg4BOUMQAAYAQGKIYBkAKBQAGaAoDDYMgzQwAAxDELMEwsACEIrjKCVIgkHYJRjGEZxMAsEwjAoaQChEZRUhEMgxDDIIyAJIcaw0GSEZwgOQZBi' +
	'OEYnDANkIYJDSIYHTZIUzTJAdGSVJKNKAoKCaEgORo5SpNUghBDYKQTJyeagkaaRVCWLplRCNIwWNJdVwjEaQaaiarKNqKNpSViAEqSdKEZRLOyRZyiKQMEreY4EUDQc' +
	'xUPYMNYaAC6AAparpbwCFpSYpRND3TaEE4jSLKAA0HD6QqebIDDJaFq6PbVXSTOLPNhgPQcWxeVJBXjLExUALGSYLC6nKayHZcHACKK5VbVW6ZZDdNy/BLQeD4QANG4r' +
	'iuNJriMV4dgWVgHh+ZpgCeEIQEQJIgGkMYdA6JwjC0VAAmaJgQgmPp4lCWgSCiaB+DKIYIjqQpllMf6JgYAoAmASAWAaAZggQDJ/gKYJIDYDoDmECBGAOBBhEgVgUgSY' +
	'RoGYGYGCGKB2BCBwhmiBgLggIgoHoJIJGGKIeCiBYiiiLgXgCIpohoMIMGKGJODSCwghiZg6g6Y5InYPh/lAECAg');
		Add(2,'CP:1 2 2 -2 -2');
		Add(3,'CP:1 -5 -5 5 5');
		Add(4,'XP:Window 19 1');
		Add(5,'XP:TreeView 2 1');
	end;
	Columns.Add('Task');
	with Chart do
	begin
		FirstVisibleDate := '1/1/2001';
		PaneWidth[False] := 128;
		DrawGridLines := EXG2ANTTLib_TLB.exHLines;
	end;
	with Items do
	begin
		h := AddItem('Default');
		AddBar(h,'Task','1/2/2001','1/5/2001','K1',Null);
		h := AddItem('Red-Frame');
		AddBar(h,'Task','1/3/2001','1/6/2001','K1',Null);
		ItemBar[h,'K1',EXG2ANTTLib_TLB.exBarFrameColor] := OleVariant(255);
		h := AddItem('Green-ThickFrame');
		AddBar(h,'Task','1/4/2001','1/7/2001','K1',Null);
		ItemBar[h,'K1',EXG2ANTTLib_TLB.exBarPattern] := OleVariant(4099);
		ItemBar[h,'K1',EXG2ANTTLib_TLB.exBarFrameColor] := OleVariant(32768);
		h := AddItem('Red-ThickFrame/Shadow');
		AddBar(h,'Task','1/4/2001','1/7/2001','K1',Null);
		ItemBar[h,'K1',EXG2ANTTLib_TLB.exBarPattern] := OleVariant(12291);
		ItemBar[h,'K1',EXG2ANTTLib_TLB.exBarFrameColor] := OleVariant(255);
		h := AddItem('EBN-Frame-Border');
		AddBar(h,'Task','1/5/2001','1/9/2001','K2',Null);
		ItemBar[h,'K2',EXG2ANTTLib_TLB.exBarFrameColor] := OleVariant(16777216);
		h := AddItem('EBN-Inside Frame');
		AddBar(h,'Task','1/9/2001','1/13/2001','K3',Null);
		ItemBar[h,'K3',EXG2ANTTLib_TLB.exBarFrameColor] := OleVariant(33554432);
		h := AddItem('EBN-Outside Frame');
		AddBar(h,'Task','1/15/2001','1/18/2001','K4',Null);
		ItemBar[h,'K4',EXG2ANTTLib_TLB.exBarFrameColor] := OleVariant(50331648);
		h := AddItem('EBN-XP Close Button');
		AddBar(h,'Task','1/15/2001','1/18/2001','K5',Null);
		ItemBar[h,'K5',EXG2ANTTLib_TLB.exBarFrameColor] := OleVariant(67108864);
		h := AddItem('EBN-XP TreeView Glyph');
		AddBar(h,'Task','1/15/2001','1/18/2001','K6',Null);
		ItemBar[h,'K6',EXG2ANTTLib_TLB.exBarFrameColor] := OleVariant(83886080);
	end;
	EndUpdate();
end
|
|
1342
|
Currently your control, provides customization up to Year,Month,Day,Hours,etc. I would like to add Shifts in a day. Shortly, I need to customize the chart's header. Is it possible
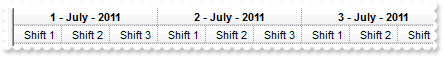
with G2antt1 do
begin
	BeginUpdate();
	with Chart do
	begin
		FirstVisibleDate := '7/1/2011';
		AdjustLevelsToBase := True;
		PaneWidth[False] := 0;
		LevelCount := 2;
		with Level[0] do
		begin
			Alignment := EXG2ANTTLib_TLB.CenterAlignment;
			Label := '<b><%d%> - <%mmmm%> - <%yyyy%>';
			Unit := EXG2ANTTLib_TLB.exDay;
		end;
		with Level[1] do
		begin
			Label := '<%h%>';
			Count := 8;
			Unit := EXG2ANTTLib_TLB.exHour;
			ReplaceLabel[0] := ' Shift 1';
			ReplaceLabel[8] := ' Shift 2';
			ReplaceLabel[16] := ' Shift 3';
		end;
		UnitWidth := 48;
		NonworkingDays := 0;
	end;
	EndUpdate();
end
|
|
1341
|
The exbartootip shows dates after you moved or resized the bar. My question is during the move or resizing of bar(you click on bar and drag it,during that time) , can we display the new dates simultaneously so we will know where we want to move or resize the bar to
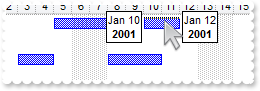
with G2antt1 do
begin
	Columns.Add('Task');
	with Chart do
	begin
		PaneWidth[False] := 64;
		FirstVisibleDate := '1/1/2001';
		DrawDateTicker := True;
		DateTickerLabel := '<%mmm%> <%d%><br><b><%yyyy%>';
	end;
	with Items do
	begin
		h := AddItem('Tasks A');
		AddBar(h,'Task','1/2/2001','1/4/2001','K1',Null);
		AddBar(h,'Task','1/5/2001','1/9/2001','K2',Null);
		SelectableItem[AddItem(Null)] := False;
		h := AddItem('Tasks B');
		AddBar(h,'Task','1/3/2001','1/5/2001','K1',Null);
		AddBar(h,'Task','1/8/2001','1/11/2001','K2',Null);
	end;
end
|
|
1340
|
Is it possible to assign a tooltip automatically to all bars, so it can display the start and end, without specifying the IexBarToolTip for each bar
with G2antt1 do
begin
	Columns.Add('Task');
	with Chart do
	begin
		PaneWidth[False] := 64;
		FirstVisibleDate := '1/1/2001';
		Bars.Item['Task'].Def[EXG2ANTTLib_TLB.exBarToolTip] := '<b><%=%9 + ''/'' + %C0%></b><br><upline><dotline>Start: <%=%1%><br>End: <%=%2%><br>Duration: <%=(%2-%1)%><br>Working: <%=%258%>';
	end;
	with Items do
	begin
		h := AddItem('Tasks A');
		AddBar(h,'Task','1/2/2001','1/4/2001','K1',Null);
		AddBar(h,'Task','1/5/2001','1/9/2001','K2',Null);
		h := AddItem('Tasks B');
		AddBar(h,'Task','1/3/2001','1/5/2001','K1',Null);
		AddBar(h,'Task','1/8/2001','1/11/2001','K2',Null);
	end;
end
|
|
1339
|
How can I change the color, font, bold etc for the items/cells in the same column or for the entire column
with G2antt1 do
begin
	BeginUpdate();
	with ConditionalFormats.Add('1',Null) do
	begin
		Bold := True;
		ForeColor := $ff;
		ApplyTo := EXG2ANTTLib_TLB.FormatApplyToEnum($1);
	end;
	Columns.Add('C1');
	with (IUnknown(Columns.Add('C2')) as EXG2ANTTLib_TLB.Column) do
	begin
		HeaderBold := True;
		HTMLCaption := '<fgcolor=FF0000>C2';
	end;
	with Items do
	begin
		CellValue[OleVariant(AddItem(OleVariant(10))),OleVariant(1)] := OleVariant(11);
		CellValue[OleVariant(AddItem(OleVariant(12))),OleVariant(1)] := OleVariant(13);
	end;
	EndUpdate();
end
|
|
1338
|
How can I remove a date-time zone
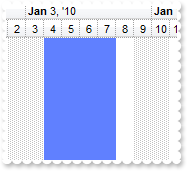
// Click event - Occurs when the user presses and then releases the left mouse button over the tree control.
procedure TForm1.G2antt1Click(ASender: TObject; );
begin
	with G2antt1 do
	begin
		Chart.RemoveTimeZone('Z1');
	end
end;

with G2antt1 do
begin
	with Chart do
	begin
		PaneWidth[False] := 18;
		LevelCount := 2;
		FirstVisibleDate := '1/1/2010';
		MarkTimeZone('Z1','1/4/2010','1/8/2010',OleVariant(16744544),Null);
	end;
end
|
|
1337
|
How can I filter the check-boxes (method 2)
with G2antt1 do
begin
	with (IUnknown(Columns.Add('Check')) as EXG2ANTTLib_TLB.Column) do
	begin
		with Editor do
		begin
			EditType := EXG2ANTTLib_TLB.CheckValueType;
			Option[EXG2ANTTLib_TLB.exCheckValue2] := OleVariant(1);
		end;
		DisplayFilterButton := True;
		DisplayFilterPattern := False;
		CustomFilter := 'checked||-1|||unchecked||0';
	end;
	with Items do
	begin
		AddItem(OleVariant(True));
		AddItem(OleVariant(True));
		AddItem(OleVariant(False));
		AddItem(OleVariant(True));
		AddItem(OleVariant(False));
		AddItem(OleVariant(True));
		AddItem(OleVariant(False));
	end;
end
|
|
1336
|
How can I filter the check-boxes (method 1)
with G2antt1 do
begin
	with (IUnknown(Columns.Add('Check')) as EXG2ANTTLib_TLB.Column) do
	begin
		with Editor do
		begin
			EditType := EXG2ANTTLib_TLB.CheckValueType;
			Option[EXG2ANTTLib_TLB.exCheckValue2] := OleVariant(1);
		end;
		DisplayFilterButton := True;
		DisplayFilterPattern := False;
		FilterType := EXG2ANTTLib_TLB.exCheck;
	end;
	with Items do
	begin
		AddItem(OleVariant(True));
		AddItem(OleVariant(True));
		AddItem(OleVariant(False));
		AddItem(OleVariant(True));
		AddItem(OleVariant(False));
		AddItem(OleVariant(True));
		AddItem(OleVariant(False));
	end;
end
|
|
1335
|
How can add a button to control
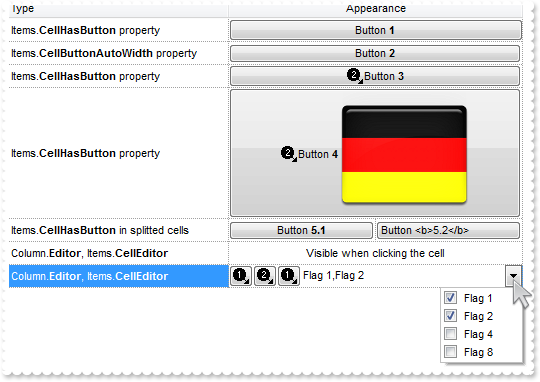
// ButtonClick event - Occurs when user clicks on the cell's button.
procedure TForm1.G2antt1ButtonClick(ASender: TObject; Item : HITEM; ColIndex : Integer; Key : OleVariant);
begin
	with G2antt1 do
	begin
		OutputDebugString( 'ButtonClick' );
		OutputDebugString( Items.CellCaption[OleVariant(Item),OleVariant(ColIndex)] );
		OutputDebugString( Key );
	end
end;

with G2antt1 do
begin
	BeginUpdate();
	DefaultItemHeight := 22;
	HeaderHeight := 22;
	Appearance := EXG2ANTTLib_TLB.None2;
	DrawGridLines := EXG2ANTTLib_TLB.exRowLines;
	ScrollBySingleLine := False;
	Images('gBJJgBAIDAAGAAEAAQhYAf8Pf4hh0QihCJo2AEZjQAjEZFEaIEaEEaAIAkcbk0olUrlktl0vmExmUzmk1m03nE5nU7nk9n0/oFBoVDolFo1HpFJpVLplNp1PqFRqVTql' +
	'Vq1XrFZrVbrldr1fsFhsVjslls1ntFptVrtltt1vuFxuVzul1u13vF5vV7vl9v1/wGBwWDwmFw2HxGJxWLxmNx0xiFdyOTh8Tf9ZymXx+QytcyNgz8r0OblWjyWds+m0' +
	'ka1Vf1ta1+r1mos2xrG2xeZ0+a0W0qOx3GO4NV3WeyvD2XJ5XL5nN51aiw+lfSj0gkUkAEllHanHI5j/cHg8EZf7w8vl8j4f/qfEZeB09/vjLAB30+kZQAP/P5/H6/yN' +
	'AOAEAwCjMBwFAEDwJBMDwLBYAP2/8Hv8/gAGAD8LQs9w/nhDY/oygIA=');
	HTMLPicture['pic1'] := 'c:\exontrol\images\auction.gif';
	Chart.PaneWidth[True] := 0;
	with Columns do
	begin
		with (IUnknown(Add('Type')) as EXG2ANTTLib_TLB.Column) do
		begin
			Width := 48;
			Def[EXG2ANTTLib_TLB.exCellValueFormat] := OleVariant(1);
		end;
		with (IUnknown(Add('Appearance')) as EXG2ANTTLib_TLB.Column) do
		begin
			Def[EXG2ANTTLib_TLB.exCellValueFormat] := OleVariant(1);
			Alignment := EXG2ANTTLib_TLB.CenterAlignment;
			HeaderAlignment := EXG2ANTTLib_TLB.CenterAlignment;
		end;
	end;
	with Items do
	begin
		h := AddItem('Items.<b>CellHasButton</b> property');
		CellValue[OleVariant(h),OleVariant(1)] := 'Button <b>1</b>';
		CellHasButton[OleVariant(h),OleVariant(1)] := True;
		h := AddItem('Items.<b>CellButtonAutoWidth</b> property');
		CellValue[OleVariant(h),OleVariant(1)] := ' Button <b>2</b> ';
		CellHasButton[OleVariant(h),OleVariant(1)] := True;
		CellButtonAutoWidth[OleVariant(h),OleVariant(1)] := True;
		h := AddItem('Items.<b>CellHasButton</b> property');
		CellValue[OleVariant(h),OleVariant(1)] := ' <img>2</img>Button <b>3</b> ';
		CellHasButton[OleVariant(h),OleVariant(1)] := True;
		CellButtonAutoWidth[OleVariant(h),OleVariant(1)] := True;
		h := AddItem('Items.<b>CellHasButton</b> property');
		ItemHeight[h] := 32;
		CellValue[OleVariant(h),OleVariant(1)] := ' <img>2</img>Button <b>4</b> <img>pic1</img> ';
		CellHasButton[OleVariant(h),OleVariant(1)] := True;
		CellButtonAutoWidth[OleVariant(h),OleVariant(1)] := True;
		h := AddItem('Items.<b>CellHasButton</b> in splitted cells');
		CellValue[OleVariant(h),OleVariant(1)] := ' Button <b>5.1</b> ';
		CellHasButton[OleVariant(h),OleVariant(1)] := True;
		CellButtonAutoWidth[OleVariant(h),OleVariant(1)] := True;
		s := SplitCell[OleVariant(h),OleVariant(1)];
		CellValue[OleVariant(0),OleVariant(s)] := ' Button <b>5.2</b> ';
		CellHasButton[OleVariant(0),OleVariant(s)] := True;
		CellButtonAutoWidth[OleVariant(0),OleVariant(s)] := True;
		h := AddItem('Column.<b>Editor</b>, Items.<b>CellEditor</b>');
		CellValue[OleVariant(h),OleVariant(1)] := 'Visible when clicking the cell';
		with CellEditor[OleVariant(h),OleVariant(1)] do
		begin
			EditType := EXG2ANTTLib_TLB.EditType;
			AddButton('B1',OleVariant(1),OleVariant(0),'This is a bit of text that''s shown when the cursor hovers the button B1',Null,Null);
			AddButton('B3',OleVariant(2),OleVariant(1),'This is a bit of text that''s shown when the cursor hovers the button B3',Null,Null);
			AddButton('B4',OleVariant(1),OleVariant(1),'This is a bit of text that''s shown when the cursor hovers the button B4',Null,Null);
			ButtonWidth := 24;
		end;
		h := AddItem('Column.<b>Editor</b>, Items.<b>CellEditor</b>');
		CellValue[OleVariant(h),OleVariant(1)] := OleVariant(3);
		with CellEditor[OleVariant(h),OleVariant(1)] do
		begin
			EditType := EXG2ANTTLib_TLB.CheckListType;
			AddItem(1,'Flag 1',Null);
			AddItem(2,'Flag 2',Null);
			AddItem(4,'Flag 4',Null);
			AddItem(8,'Flag 8',Null);
			AddButton('C1',OleVariant(1),OleVariant(0),'This is a bit of text that''s shown when the cursor hovers the button C1',Null,Null);
			AddButton('C3',OleVariant(2),OleVariant(0),'This is a bit of text that''s shown when the cursor hovers the button C2',Null,Null);
			AddButton('C4',OleVariant(1),OleVariant(0),'This is a bit of text that''s shown when the cursor hovers the button C3',Null,Null);
			ButtonWidth := 24;
		end;
	end;
	EndUpdate();
end
|
|
1334
|
Is it posible to store additional values against each item, cell, bar, link, such as custom values such string / numbers etc
with G2antt1 do
begin
	with Chart do
	begin
		LevelCount := 2;
		FirstVisibleDate := '1/1/2001';
		PaneWidth[False] := 96;
	end;
	(IUnknown(Columns.Add('Column')) as EXG2ANTTLib_TLB.Column).Data := 'Extra_Data_Column';
	with Items do
	begin
		h := AddItem('Item 1');
		ItemData[h] := 'Extra_Data_Item 1';
		CellData[OleVariant(h),OleVariant(0)] := 'Extra_Data_Item 1_Cell_0';
		AddBar(h,'Task','1/2/2001','1/4/2001','B1',Null);
		ItemBar[h,'B1',EXG2ANTTLib_TLB.exBarData] := 'Extra_B1_Data';
		h := AddItem('Item 2');
		ItemData[h] := 'Extra_Data_Item 2';
		AddBar(h,'Task','1/6/2001','1/10/2001','B2',Null);
		ItemBar[h,'B2',EXG2ANTTLib_TLB.exBarData] := 'Extra_B2_Data';
		AddLink('L1',FindItem['Item 1',OleVariant(0),Null],'B1',FindItem['Item 2',OleVariant(0),Null],'B2');
		Link['L1',EXG2ANTTLib_TLB.exLinkUserData] := 'Extra_Link_Data';
	end;
end
|
|
1333
|
How do I set the parent item to show the total number of days for its children and also the minimum and maximum dates for its children
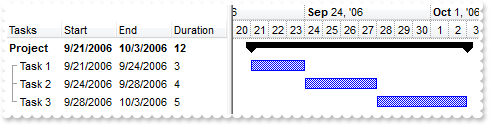
with G2antt1 do
begin
	BeginUpdate();
	MarkSearchColumn := False;
	Indent := 11;
	HasLines := EXG2ANTTLib_TLB.exSolidLine;
	Items.AllowCellValueToItemBar := True;
	with Columns do
	begin
		Add('Tasks');
		(IUnknown(Add('Start')) as EXG2ANTTLib_TLB.Column).Def[EXG2ANTTLib_TLB.exCellValueToItemBarProperty] := OleVariant(1);
		(IUnknown(Add('End')) as EXG2ANTTLib_TLB.Column).Def[EXG2ANTTLib_TLB.exCellValueToItemBarProperty] := OleVariant(2);
		(IUnknown(Add('Duration')) as EXG2ANTTLib_TLB.Column).Def[EXG2ANTTLib_TLB.exCellValueToItemBarProperty] := OleVariant(513);
	end;
	with Chart do
	begin
		ShowNonworkingDates := False;
		FirstVisibleDate := '9/20/2006';
		AllowLinkBars := False;
		AllowCreateBar := EXG2ANTTLib_TLB.exNoCreateBar;
		LevelCount := 2;
		PaneWidth[False] := 220;
	end;
	with Items do
	begin
		h := AddItem('Project');
		AddBar(h,'Summary','9/21/2006','10/3/2006',Null,Null);
		h1 := InsertItem(h,Null,'Task 1');
		AddBar(h1,'Task','9/21/2006','9/24/2006',Null,Null);
		h2 := InsertItem(h,Null,'Task 2');
		AddBar(h2,'Task','9/24/2006','9/28/2006',Null,Null);
		h3 := InsertItem(h,Null,'Task 3');
		AddBar(h3,'Task','9/28/2006','10/3/2006',Null,Null);
		DefineSummaryBars(h,'',h1,'');
		DefineSummaryBars(h,'',h2,'');
		DefineSummaryBars(h,'',h3,'');
		ExpandItem[h] := True;
		ItemBold[h] := True;
	end;
	EndUpdate();
end
|
|
1332
|
Is it possible to specify the distance between 2 bars to be at least 2 working days
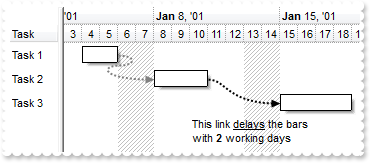
// BarResizing event - Occurs when a bar is moving or resizing.
procedure TForm1.G2antt1BarResizing(ASender: TObject; Item : HITEM; Key : OleVariant);
begin
	with G2antt1 do
	begin
		Items.SchedulePDM(Item,OleVariant(Key));
	end
end;

with G2antt1 do
begin
	BeginUpdate();
	DefaultItemHeight := 24;
	AntiAliasing := True;
	Columns.Add('Task');
	with Chart do
	begin
		LevelCount := 2;
		with Bars.Add('Task:Split') do
		begin
			Shortcut := 'Task';
			Color := $0;
			Height := 17;
			Pattern := EXG2ANTTLib_TLB.exPatternFrameShadow;
		end;
		FirstVisibleDate := '1/3/2001';
		PaneWidth[False] := 48;
		LinksWidth := 2;
		AllowCreateBar := EXG2ANTTLib_TLB.exNoCreateBar;
		AllowLinkBars := False;
		FirstWeekDay := EXG2ANTTLib_TLB.exMonday;
		NonworkingDaysPattern := EXG2ANTTLib_TLB.exPatternBDiagonal;
	end;
	with Items do
	begin
		h1 := AddItem('Task 1');
		AddBar(h1,'Task','1/4/2001','1/6/2001','K1',Null);
		ItemBar[h1,'K1',EXG2ANTTLib_TLB.exBarKeepWorkingCount] := OleVariant(True);
		h2 := AddItem('Task 2');
		AddBar(h2,'Task','1/2/2001','1/5/2001','K2',Null);
		ItemBar[h2,'K2',EXG2ANTTLib_TLB.exBarKeepWorkingCount] := OleVariant(True);
		AddLink('L1',h1,'K1',h2,'K2');
		Link['L1',EXG2ANTTLib_TLB.exLinkShowRound] := OleVariant(-1);
		Link['L1',EXG2ANTTLib_TLB.exLinkColor] := OleVariant(8421504);
		h3 := AddItem('Task 3');
		AddBar(h3,'Task','1/2/2001','1/6/2001','K3',Null);
		ItemBar[h3,'K3',EXG2ANTTLib_TLB.exBarKeepWorkingCount] := OleVariant(True);
		AddLink('L2',h2,'K2',h3,'K3');
		Link['L2',EXG2ANTTLib_TLB.exLinkText] := '<br><br><br><br>This link <u>delays</u> the bars<br>with <b>2</b> working days';
		Link['L2',EXG2ANTTLib_TLB.exLinkPDMWorkingDelay] := OleVariant(2);
		Link['L2',EXG2ANTTLib_TLB.exLinkShowRound] := OleVariant(-1);
		SchedulePDM(0,'K1');
	end;
	EndUpdate();
end
|
|
1331
|
The item is not getting selected when clicking the cell's checkbox. What should I do
// CellStateChanged event - Fired after cell's state has been changed.
procedure TForm1.G2antt1CellStateChanged(ASender: TObject; Item : HITEM; ColIndex : Integer);
begin
	with G2antt1 do
	begin
		Items.SelectItem[Item] := True;
	end
end;

with G2antt1 do
begin
	(IUnknown(Columns.Add('Check')) as EXG2ANTTLib_TLB.Column).Def[EXG2ANTTLib_TLB.exCellHasCheckBox] := OleVariant(True);
	with Items do
	begin
		AddItem(OleVariant(0));
		AddItem(OleVariant(1));
		AddItem(OleVariant(2));
		AddItem(OleVariant(3));
	end;
end
|
|
1330
|
How can I add a summary item as a child or subitem of another one
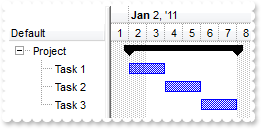
with G2antt1 do
begin
	BeginUpdate();
	with Chart do
	begin
		PaneWidth[False] := 96;
		FirstVisibleDate := '1/1/2011';
		LevelCount := 2;
	end;
	Columns.Add('Default');
	LinesAtRoot := EXG2ANTTLib_TLB.exLinesAtRoot;
	with Items do
	begin
		hSummary := AddItem('Project');
		AddBar(hSummary,'Summary','1/1/2011','1/1/2011','Sum',Null);
		hChild := InsertItem(hSummary,OleVariant(0),'Task 1');
		AddBar(hChild,'Task','1/2/2011','1/4/2011','Task1',Null);
		DefineSummaryBars(hSummary,'Sum',hChild,'Task1');
		hChild := InsertItem(hSummary,OleVariant(0),'Task 2');
		AddBar(hChild,'Task','1/4/2011','1/6/2011','Task2',Null);
		DefineSummaryBars(hSummary,'Sum',hChild,'Task2');
		hChild := InsertItem(hSummary,OleVariant(0),'Task 3');
		AddBar(hChild,'Task','1/6/2011','1/8/2011','Task3',Null);
		DefineSummaryBars(hSummary,'Sum',hChild,'Task3');
		ExpandItem[hSummary] := True;
	end;
	EndUpdate();
end
|
|
1329
|
How can I make an item a subitem of another one
with G2antt1 do
begin
	BeginUpdate();
	LinesAtRoot := EXG2ANTTLib_TLB.exLinesAtRoot;
	Chart.PaneWidth[True] := 0;
	Columns.Add('Default');
	with Items do
	begin
		hSummary := AddItem('Project');
		hChild := InsertItem(hSummary,OleVariant(0),'Task 1');
		hChild := InsertItem(hSummary,OleVariant(0),'Task 2');
		hChild := InsertItem(hSummary,OleVariant(0),'Task 3');
		ExpandItem[hSummary] := True;
	end;
	EndUpdate();
end
|
|
1328
|
Is it possible to move a bar per drag and drop to another owner/item
with G2antt1 do
begin
	BeginUpdate();
	(IUnknown(Columns.Add('Members')) as EXG2ANTTLib_TLB.Column).Def[EXG2ANTTLib_TLB.exCellValueFormat] := OleVariant(1);
	with Chart do
	begin
		FirstVisibleDate := '9/20/2006';
		AllowLinkBars := False;
		AllowCreateBar := EXG2ANTTLib_TLB.exNoCreateBar;
		AllowSelectObjects := EXG2ANTTLib_TLB.exNoSelectObjects;
		LevelCount := 2;
		PaneWidth[False] := 96;
		Bars.Item['Task'].OverlaidType := Integer(EXG2ANTTLib_TLB.exOverlaidBarsIncludeCaption) Or Integer(EXG2ANTTLib_TLB.exOverlaidBarsStackAutoArrange) Or Integer(EXG2ANTTLib_TLB.exOverlaidBarsStack);
	end;
	with Items do
	begin
		h := AddItem('Member <b>1</b>');
		AddBar(h,'Task','9/21/2006','9/23/2006','T102','Task <b>102</b>');
		ItemBar[h,'T102',EXG2ANTTLib_TLB.exBarHAlignCaption] := OleVariant(18);
		ItemBar[h,'T102',EXG2ANTTLib_TLB.exBarCanMoveToAnother] := OleVariant(True);
		h := AddItem('Member <b>2</b>');
		h := AddItem('Member <b>3</b>');
		h := AddItem('Member <b>4</b>');
		AddBar(h,'Task','9/21/2006','9/23/2006','T103','Task <b>103</b>');
		ItemBar[h,'T103',EXG2ANTTLib_TLB.exBarHAlignCaption] := OleVariant(18);
		ItemBar[h,'T103',EXG2ANTTLib_TLB.exBarCanMoveToAnother] := OleVariant(True);
	end;
	EndUpdate();
end
|
|
1327
|
I have the chart displaying days, is it possible to display bars/tasks up to hours so inside days somehow
with G2antt1 do
begin
	BeginUpdate();
	with Chart do
	begin
		LevelCount := 2;
		UnitWidth := 38;
		PaneWidth[False] := 28;
		FirstVisibleDate := '3/4/2011';
		UnitScale := EXG2ANTTLib_TLB.exDay;
		ResizeUnitScale := EXG2ANTTLib_TLB.exHour;
	end;
	Columns.Add('Default');
	with Items do
	begin
		AddBar(AddItem('ASS'),'Task','3/7/2011','3/7/2011 3:30:00 AM',Null,Null);
		AddBar(AddItem('EMB'),'Task','3/7/2011 3:30:00 AM','3/8/2011 9:15:00 AM',Null,Null);
		AddBar(AddItem('TES'),'Task','3/8/2011 9:15:00 AM','3/8/2011 1:45:00 PM',Null,Null);
	end;
	EndUpdate();
end
|
|
1326
|
Is it possible to limit the height of the item while resizing
// AddItem event - Occurs after a new Item has been inserted to Items collection.
procedure TForm1.G2antt1AddItem(ASender: TObject; Item : HITEM);
begin
with G2antt1 do
begin
Items.ItemMinHeight[Item] := 18;
Items.ItemMaxHeight[Item] := 72;
end
end;
with G2antt1 do
begin
BeginUpdate();
ItemsAllowSizing := EXG2ANTTLib_TLB.exResizeItem;
ScrollBySingleLine := False;
BackColorAlternate := RGB(240,240,240);
Columns.Add('Names');
with Items do
begin
AddItem('Mantel');
AddItem('Mechanik');
AddItem('Motor');
AddItem('Murks');
AddItem('M�rchen');
AddItem('M�hren');
AddItem('M�hle');
end;
Columns.Item[OleVariant(0)].SortOrder := EXG2ANTTLib_TLB.SortAscending;
EndUpdate();
end
|
|
1325
|
Is it possible to copy the hierarchy of the control using the GetItems method
with G2antt1 do
begin
	LinesAtRoot := EXG2ANTTLib_TLB.exLinesAtRoot;
	Columns.Add('Def');
	with Items do
	begin
		h := AddItem('Root');
		InsertItem(h,Null,'Child 1');
		InsertItem(h,Null,'Child 2');
	end;
	PutItems(GetItems(OleVariant(-1)),Null);
end
|
|
1324
|
I have found a property ReadOnly but this doesn't work correctly. I need the chart part of the control to be readonly too. Is it possible
with G2antt1 do
begin
	ReadOnly := EXG2ANTTLib_TLB.exReadOnly;
	with Chart do
	begin
		AllowCreateBar := EXG2ANTTLib_TLB.exNoCreateBar;
		BarsAllowSizing := False;
		AllowLinkBars := False;
	end;
end
|
|
1323
|
How can I select a column
// MouseDown event - Occurs when the user presses a mouse button.
procedure TForm1.G2antt1MouseDown(ASender: TObject; Button : Smallint; Shift : Smallint; X : Integer; Y : Integer);
begin
	with G2antt1 do
	begin
		BeginUpdate();
		Columns.Item[OleVariant(G2antt1.ColumnFromPoint[X,Y])].Selected := True;
		Items.SelectAll();
		EndUpdate();
	end
end;

with G2antt1 do
begin
	BeginUpdate();
	MarkSearchColumn := False;
	SingleSel := False;
	FullRowSelect := EXG2ANTTLib_TLB.exRectSel;
	SortOnClick := EXG2ANTTLib_TLB.exNoSort;
	with Columns do
	begin
		Add('Column1');
		Add('Column2');
	end;
	with Items do
	begin
		CellValue[OleVariant(AddItem('One')),OleVariant(1)] := 'One';
		CellValue[OleVariant(AddItem('Two')),OleVariant(1)] := 'Two';
	end;
	EndUpdate();
end
|
|
1322
|
I have several columns, but noticed that the filter is using AND between columns, but I need OR clause for filtering. Is it possible
with G2antt1 do
begin
	BeginUpdate();
	Chart.PaneWidth[True] := 0;
	LinesAtRoot := EXG2ANTTLib_TLB.exLinesAtRoot;
	with (IUnknown(Columns.Add('Item')) as EXG2ANTTLib_TLB.Column) do
	begin
		DisplayFilterButton := True;
		DisplayFilterPattern := False;
		Filter := 'Child 1';
		FilterType := EXG2ANTTLib_TLB.exFilter;
	end;
	with (IUnknown(Columns.Add('Date')) as EXG2ANTTLib_TLB.Column) do
	begin
		DisplayFilterButton := True;
		DisplayFilterPattern := False;
		DisplayFilterDate := True;
		FilterList := Integer(EXG2ANTTLib_TLB.exShowExclude) Or Integer(EXG2ANTTLib_TLB.exShowFocusItem) Or Integer(EXG2ANTTLib_TLB.exShowCheckBox) Or Integer(EXG2ANTTLib_TLB.exNoItems);
		Filter := '12/28/2010';
		FilterType := EXG2ANTTLib_TLB.exDate;
	end;
	FilterCriteria := '%0 or %1';
	Description[EXG2ANTTLib_TLB.exFilterBarOr] := '<font ;18><fgcolor=FF0000>or</fgcolor></font>';
	Description[EXG2ANTTLib_TLB.exFilterBarAnd] := '<font ;18><fgcolor=FF0000>and</fgcolor></font>';
	with Items do
	begin
		h := AddItem('Root 1');
		CellValue[OleVariant(InsertItem(h,Null,'Child 1')),OleVariant(1)] := '12/27/2010';
		CellValue[OleVariant(InsertItem(h,Null,'Child 2')),OleVariant(1)] := '12/28/2010';
		ExpandItem[h] := True;
		h := AddItem('Root 2');
		CellValue[OleVariant(InsertItem(h,Null,'Child 1')),OleVariant(1)] := '12/29/2010';
		CellValue[OleVariant(InsertItem(h,Null,'Child 2')),OleVariant(1)] := '12/30/2010';
	end;
	ApplyFilter();
	EndUpdate();
end
|
|
1321
|
Is it possible exclude the dates being selected in the drop down filter window
with G2antt1 do
begin
	BeginUpdate();
	Chart.PaneWidth[True] := 0;
	with (IUnknown(Columns.Add('Date')) as EXG2ANTTLib_TLB.Column) do
	begin
		SortType := EXG2ANTTLib_TLB.SortDate;
		DisplayFilterButton := True;
		DisplayFilterPattern := False;
		DisplayFilterDate := True;
		FilterList := Integer(EXG2ANTTLib_TLB.exShowExclude) Or Integer(EXG2ANTTLib_TLB.exShowFocusItem) Or Integer(EXG2ANTTLib_TLB.exShowCheckBox) Or Integer(EXG2ANTTLib_TLB.exNoItems);
	end;
	with Items do
	begin
		AddItem('12/27/2010');
		AddItem('12/28/2010');
		AddItem('12/29/2010');
		AddItem('12/30/2010');
		AddItem('12/31/2010');
	end;
	EndUpdate();
end
|
|
1320
|
How can I display a calendar control inside the drop down filter window
with G2antt1 do
begin
	BeginUpdate();
	Chart.PaneWidth[True] := 0;
	with (IUnknown(Columns.Add('Date')) as EXG2ANTTLib_TLB.Column) do
	begin
		SortType := EXG2ANTTLib_TLB.SortDate;
		DisplayFilterButton := True;
		DisplayFilterPattern := False;
		DisplayFilterDate := True;
		FilterList := Integer(EXG2ANTTLib_TLB.exShowFocusItem) Or Integer(EXG2ANTTLib_TLB.exShowCheckBox) Or Integer(EXG2ANTTLib_TLB.exNoItems);
	end;
	with Items do
	begin
		AddItem('12/27/2010');
		AddItem('12/28/2010');
		AddItem('12/29/2010');
		AddItem('12/30/2010');
		AddItem('12/31/2010');
	end;
	EndUpdate();
end
|
|
1319
|
Is it possible to include the dates as checkb-boxes in the drop down filter window
with G2antt1 do
begin
	BeginUpdate();
	Chart.PaneWidth[True] := 0;
	with (IUnknown(Columns.Add('Dates')) as EXG2ANTTLib_TLB.Column) do
	begin
		SortType := EXG2ANTTLib_TLB.SortDate;
		DisplayFilterButton := True;
		DisplayFilterPattern := True;
		DisplayFilterDate := True;
		FilterList := Integer(EXG2ANTTLib_TLB.exShowFocusItem) Or Integer(EXG2ANTTLib_TLB.exShowCheckBox);
		Filter := 'to 12/27/2010';
		FilterType := EXG2ANTTLib_TLB.exDate;
	end;
	with Items do
	begin
		AddItem('12/27/2010');
		AddItem('12/28/2010');
		AddItem('12/29/2010');
		AddItem('12/30/2010');
		AddItem('12/31/2010');
	end;
	ApplyFilter();
	EndUpdate();
end
|
|
1318
|
How can I filter items for dates before a specified date
with G2antt1 do
begin
	BeginUpdate();
	Chart.PaneWidth[True] := 0;
	with (IUnknown(Columns.Add('Dates')) as EXG2ANTTLib_TLB.Column) do
	begin
		SortType := EXG2ANTTLib_TLB.SortDate;
		DisplayFilterButton := True;
		DisplayFilterPattern := True;
		DisplayFilterDate := True;
		FilterList := Integer(EXG2ANTTLib_TLB.exShowFocusItem) Or Integer(EXG2ANTTLib_TLB.exNoItems);
		Filter := 'to 12/27/2010';
		FilterType := EXG2ANTTLib_TLB.exDate;
	end;
	with Items do
	begin
		AddItem('12/27/2010');
		AddItem('12/28/2010');
		AddItem('12/29/2010');
		AddItem('12/30/2010');
		AddItem('12/31/2010');
	end;
	ApplyFilter();
	EndUpdate();
end
|
|
1317
|
Is it possible to filter dates
with G2antt1 do
begin
	BeginUpdate();
	Chart.PaneWidth[True] := 0;
	with (IUnknown(Columns.Add('Dates')) as EXG2ANTTLib_TLB.Column) do
	begin
		SortType := EXG2ANTTLib_TLB.SortDate;
		DisplayFilterButton := True;
		DisplayFilterPattern := True;
		DisplayFilterDate := True;
		FilterList := Integer(EXG2ANTTLib_TLB.exShowFocusItem) Or Integer(EXG2ANTTLib_TLB.exNoItems);
	end;
	with Items do
	begin
		AddItem('12/27/2010');
		AddItem('12/28/2010');
		AddItem('12/29/2010');
		AddItem('12/30/2010');
		AddItem('12/31/2010');
	end;
	EndUpdate();
end
|
|
1316
|
Is it possible to change the Exclude field name to something different, in the drop down filter window
with G2antt1 do
begin
	BeginUpdate();
	Chart.PaneWidth[True] := 0;
	LinesAtRoot := EXG2ANTTLib_TLB.exLinesAtRoot;
	Description[EXG2ANTTLib_TLB.exFilterBarExclude] := 'Leaving out';
	with (IUnknown(Columns.Add('Items')) as EXG2ANTTLib_TLB.Column) do
	begin
		DisplayFilterButton := True;
		DisplayFilterPattern := False;
		FilterList := Integer(EXG2ANTTLib_TLB.exShowExclude) Or Integer(EXG2ANTTLib_TLB.exShowFocusItem) Or Integer(EXG2ANTTLib_TLB.exShowCheckBox);
	end;
	with Items do
	begin
		h := AddItem('Root 1');
		InsertItem(h,Null,'Child 1');
		InsertItem(h,Null,'Child 2');
		ExpandItem[h] := True;
		h := AddItem('Root 2');
		InsertItem(h,Null,'Child 1');
	end;
	EndUpdate();
end
|
|
1315
|
How can I display the Exclude field in the drop down filter window
with G2antt1 do
begin
	BeginUpdate();
	Chart.PaneWidth[True] := 0;
	LinesAtRoot := EXG2ANTTLib_TLB.exLinesAtRoot;
	with (IUnknown(Columns.Add('Items')) as EXG2ANTTLib_TLB.Column) do
	begin
		DisplayFilterButton := True;
		DisplayFilterPattern := False;
		FilterList := Integer(EXG2ANTTLib_TLB.exShowExclude) Or Integer(EXG2ANTTLib_TLB.exShowFocusItem) Or Integer(EXG2ANTTLib_TLB.exShowCheckBox);
	end;
	with Items do
	begin
		h := AddItem('Root 1');
		InsertItem(h,Null,'Child 1');
		InsertItem(h,Null,'Child 2');
		ExpandItem[h] := True;
		h := AddItem('Root 2');
		InsertItem(h,Null,'Child 1');
	end;
	EndUpdate();
end
|
|
1314
|
Is it possible to show and ensure the focused item from the control, in the drop down filter window
with G2antt1 do
begin
	BeginUpdate();
	Chart.PaneWidth[True] := 0;
	LinesAtRoot := EXG2ANTTLib_TLB.exLinesAtRoot;
	with (IUnknown(Columns.Add('Items')) as EXG2ANTTLib_TLB.Column) do
	begin
		DisplayFilterButton := True;
		DisplayFilterPattern := False;
		FilterList := Integer(EXG2ANTTLib_TLB.exShowFocusItem) Or Integer(EXG2ANTTLib_TLB.exShowCheckBox);
	end;
	with Items do
	begin
		h := AddItem('Root 1');
		InsertItem(h,Null,'Child 1');
		InsertItem(h,Null,'Child 2');
		ExpandItem[h] := True;
		h := AddItem('Root 2');
		InsertItem(h,Null,'Child 1');
		SelectItem[InsertItem(h,Null,'Child 2')] := True;
		ExpandItem[h] := True;
	end;
	EndUpdate();
end
|
|
1313
|
Is it possible to show only blanks items with no listed items from the control
with G2antt1 do
begin
	BeginUpdate();
	Chart.PaneWidth[True] := 0;
	LinesAtRoot := EXG2ANTTLib_TLB.exLinesAtRoot;
	with (IUnknown(Columns.Add('Items')) as EXG2ANTTLib_TLB.Column) do
	begin
		DisplayFilterButton := True;
		DisplayFilterPattern := False;
		FilterList := Integer(EXG2ANTTLib_TLB.exShowBlanks) Or Integer(EXG2ANTTLib_TLB.exNoItems);
	end;
	with Items do
	begin
		h := AddItem('Root 1');
		InsertItem(h,Null,'Child 1');
		InsertItem(h,Null,'Child 2');
		ExpandItem[h] := True;
		h := AddItem('Root 2');
		InsertItem(h,Null,'Child 1');
		InsertItem(h,Null,'Child 2');
	end;
	EndUpdate();
end
|
|
1312
|
How can I include the blanks items in the drop down filter window
with G2antt1 do
begin
	BeginUpdate();
	Chart.PaneWidth[True] := 0;
	LinesAtRoot := EXG2ANTTLib_TLB.exLinesAtRoot;
	with (IUnknown(Columns.Add('Items')) as EXG2ANTTLib_TLB.Column) do
	begin
		DisplayFilterButton := True;
		DisplayFilterPattern := False;
		FilterList := Integer(EXG2ANTTLib_TLB.exShowBlanks) Or Integer(EXG2ANTTLib_TLB.exShowCheckBox);
	end;
	with Items do
	begin
		h := AddItem('Root 1');
		InsertItem(h,Null,'Child 1');
		InsertItem(h,Null,'Child 2');
		ExpandItem[h] := True;
		h := AddItem('Root 2');
		InsertItem(h,Null,'Child 1');
		InsertItem(h,Null,'Child 2');
	end;
	EndUpdate();
end
|
|
1311
|
How can I select multiple items in the drop down filter window, using check-boxes
with G2antt1 do
begin
	BeginUpdate();
	Chart.PaneWidth[True] := 0;
	LinesAtRoot := EXG2ANTTLib_TLB.exLinesAtRoot;
	with (IUnknown(Columns.Add('Items')) as EXG2ANTTLib_TLB.Column) do
	begin
		DisplayFilterButton := True;
		DisplayFilterPattern := False;
		FilterList := EXG2ANTTLib_TLB.exShowCheckBox;
	end;
	with Items do
	begin
		h := AddItem('Root 1');
		InsertItem(h,Null,'Child 1');
		InsertItem(h,Null,'Child 2');
		ExpandItem[h] := True;
		h := AddItem('Root 2');
		InsertItem(h,Null,'Child 1');
		InsertItem(h,Null,'Child 2');
	end;
	EndUpdate();
end
|
|
1310
|
Is it possible to allow a single item being selected in the drop down filter window
with G2antt1 do
begin
	BeginUpdate();
	Chart.PaneWidth[True] := 0;
	LinesAtRoot := EXG2ANTTLib_TLB.exLinesAtRoot;
	with (IUnknown(Columns.Add('Items')) as EXG2ANTTLib_TLB.Column) do
	begin
		DisplayFilterButton := True;
		DisplayFilterPattern := False;
		FilterList := EXG2ANTTLib_TLB.exSingleSel;
	end;
	with Items do
	begin
		h := AddItem('Root 1');
		InsertItem(h,Null,'Child 1');
		InsertItem(h,Null,'Child 2');
		ExpandItem[h] := True;
		h := AddItem('Root 2');
		InsertItem(h,Null,'Child 1');
		InsertItem(h,Null,'Child 2');
	end;
	EndUpdate();
end
|
|
1309
|
How can I display no (All) item in the drop down filter window
with G2antt1 do
begin
	BeginUpdate();
	Chart.PaneWidth[True] := 0;
	LinesAtRoot := EXG2ANTTLib_TLB.exLinesAtRoot;
	Description[EXG2ANTTLib_TLB.exFilterBarAll] := '';
	with (IUnknown(Columns.Add('Items')) as EXG2ANTTLib_TLB.Column) do
	begin
		DisplayFilterButton := True;
		DisplayFilterPattern := True;
		FilterList := EXG2ANTTLib_TLB.exNoItems;
	end;
	with Items do
	begin
		h := AddItem('Root 1');
		InsertItem(h,Null,'Child 1');
		InsertItem(h,Null,'Child 2');
		ExpandItem[h] := True;
		h := AddItem('Root 2');
		InsertItem(h,Null,'Child 1');
		InsertItem(h,Null,'Child 2');
	end;
	EndUpdate();
end
|
|
1308
|
Is it possible to display no items in the drop down filter window, so only the pattern is visible
with G2antt1 do
begin
	BeginUpdate();
	Chart.PaneWidth[True] := 0;
	LinesAtRoot := EXG2ANTTLib_TLB.exLinesAtRoot;
	with (IUnknown(Columns.Add('Items')) as EXG2ANTTLib_TLB.Column) do
	begin
		DisplayFilterButton := True;
		DisplayFilterPattern := True;
		FilterList := EXG2ANTTLib_TLB.exNoItems;
	end;
	with Items do
	begin
		h := AddItem('Root 1');
		InsertItem(h,Null,'Child 1');
		InsertItem(h,Null,'Child 2');
		ExpandItem[h] := True;
		h := AddItem('Root 2');
		InsertItem(h,Null,'Child 1');
		InsertItem(h,Null,'Child 2');
	end;
	EndUpdate();
end
|
|
1307
|
How can I specify the time-scale available when zoom-in/zoom-out or enlarging the chart
with G2antt1 do
begin
	BeginUpdate();
	Columns.Add('Task');
	with Chart do
	begin
		FirstVisibleDate := '1/1/2001';
		PaneWidth[False] := 48;
		ShowNonworkingDates := False;
		LevelCount := 3;
		UnitScale := EXG2ANTTLib_TLB.exDay;
		AllowResizeChart := Integer(EXG2ANTTLib_TLB.exAllowChangeUnitScale) Or Integer(EXG2ANTTLib_TLB.exAllowResizeChartMiddle) Or Integer(EXG2ANTTLib_TLB.exAllowResizeChartHeader);
		Label[EXG2ANTTLib_TLB.exHour] := '';
		Label[EXG2ANTTLib_TLB.exMinute] := '';
		Label[EXG2ANTTLib_TLB.exSecond] := '';
	end;
	with Items do
	begin
		AddBar(AddItem('Task A'),'Task','1/2/2001','1/6/2001','K1',Null);
		AddBar(AddItem('Task B'),'Task','1/6/2001','1/10/2001','K1',Null);
		AddBar(AddItem('Task C'),'Task','1/10/2001','1/14/2001','K1',Null);
		AddBar(AddItem(''),'','1/8/2001','1/8/2001','Info','Click the <b>middle</b> mouse button and start dragging');
	end;
	EndUpdate();
end
|
|
1306
|
How can I enable zoom-in/zoom-out or enlarging the chart, using the mouse middle button
with G2antt1 do
begin
	BeginUpdate();
	Columns.Add('Task');
	with Chart do
	begin
		FirstVisibleDate := '1/1/2001';
		PaneWidth[False] := 48;
		ShowNonworkingDates := False;
		LevelCount := 3;
		UnitScale := EXG2ANTTLib_TLB.exDay;
		AllowResizeChart := Integer(EXG2ANTTLib_TLB.exAllowChangeUnitScale) Or Integer(EXG2ANTTLib_TLB.exAllowResizeChartMiddle) Or Integer(EXG2ANTTLib_TLB.exAllowResizeChartHeader);
	end;
	with Items do
	begin
		AddBar(AddItem('Task A'),'Task','1/2/2001','1/6/2001','K1',Null);
		AddBar(AddItem('Task B'),'Task','1/6/2001','1/10/2001','K1',Null);
		AddBar(AddItem('Task C'),'Task','1/10/2001','1/14/2001','K1',Null);
		AddBar(AddItem(''),'','1/8/2001','1/8/2001','Info','Click the <b>middle</b> mouse button and start dragging');
	end;
	EndUpdate();
end
|
|
1305
|
How can I enable zoom-in/zoom-out or enlarging, using the chart's header
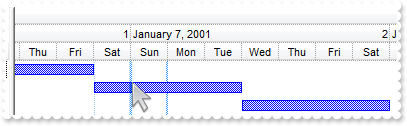
with G2antt1 do
begin
	BeginUpdate();
	Columns.Add('Task');
	with Chart do
	begin
		FirstVisibleDate := '1/1/2001';
		PaneWidth[False] := 48;
		ShowNonworkingDates := False;
		LevelCount := 3;
		UnitScale := EXG2ANTTLib_TLB.exDay;
		AllowResizeChart := Integer(EXG2ANTTLib_TLB.exAllowChangeUnitScale) Or Integer(EXG2ANTTLib_TLB.exAllowResizeChartHeader);
	end;
	with Items do
	begin
		AddBar(AddItem('Task A'),'Task','1/2/2001','1/6/2001','K1',Null);
		AddBar(AddItem('Task B'),'Task','1/6/2001','1/10/2001','K1',Null);
		AddBar(AddItem('Task C'),'Task','1/10/2001','1/14/2001','K1',Null);
	end;
	EndUpdate();
end
|
|
1304
|
How can I enable resizing the chart, using the mouse middle button
with G2antt1 do
begin
	BeginUpdate();
	Columns.Add('Task');
	with Chart do
	begin
		FirstVisibleDate := '1/1/2001';
		PaneWidth[False] := 48;
		ShowNonworkingDates := False;
		LevelCount := 3;
		UnitScale := EXG2ANTTLib_TLB.exDay;
		AllowResizeChart := Integer(EXG2ANTTLib_TLB.exAllowResizeChartMiddle) Or Integer(EXG2ANTTLib_TLB.exAllowResizeChartHeader);
		MaxUnitWidth := 128;
		MinUnitWidth := 8;
	end;
	with Items do
	begin
		AddBar(AddItem('Task A'),'Task','1/2/2001','1/6/2001','K1',Null);
		AddBar(AddItem('Task B'),'Task','1/6/2001','1/10/2001','K1',Null);
		AddBar(AddItem('Task C'),'Task','1/10/2001','1/14/2001','K1',Null);
		AddBar(AddItem(''),'','1/8/2001','1/8/2001','Info','Click the <b>middle</b> mouse button and start dragging');
	end;
	EndUpdate();
end
|
|
1303
|
How can I enable resizing the chart, using the chart's header
with G2antt1 do
begin
	BeginUpdate();
	Columns.Add('Task');
	with Chart do
	begin
		FirstVisibleDate := '1/1/2001';
		PaneWidth[False] := 48;
		ShowNonworkingDates := False;
		LevelCount := 3;
		UnitScale := EXG2ANTTLib_TLB.exDay;
		AllowResizeChart := EXG2ANTTLib_TLB.exAllowResizeChartHeader;
		MaxUnitWidth := 128;
		MinUnitWidth := 8;
	end;
	with Items do
	begin
		AddBar(AddItem('Task A'),'Task','1/2/2001','1/6/2001','K1',Null);
		AddBar(AddItem('Task B'),'Task','1/6/2001','1/10/2001','K1',Null);
		AddBar(AddItem('Task C'),'Task','1/10/2001','1/14/2001','K1',Null);
	end;
	EndUpdate();
end
|
|
1302
|
Is it possible to auto-numbering the children items but still keeps the position after filtering
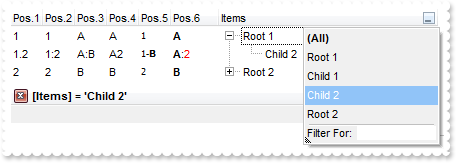
with G2antt1 do
begin
	BeginUpdate();
	Chart.PaneWidth[True] := 0;
	LinesAtRoot := EXG2ANTTLib_TLB.exLinesAtRoot;
	with (IUnknown(Columns.Add('Items')) as EXG2ANTTLib_TLB.Column) do
	begin
		DisplayFilterButton := True;
		FilterType := EXG2ANTTLib_TLB.exFilter;
		Filter := 'Child 2';
	end;
	with (IUnknown(Columns.Add('Pos.1')) as EXG2ANTTLib_TLB.Column) do
	begin
		FormatColumn := '1 ropos ''''';
		Position := 0;
		Width := 32;
		AllowSizing := False;
	end;
	with (IUnknown(Columns.Add('Pos.2')) as EXG2ANTTLib_TLB.Column) do
	begin
		FormatColumn := '1 ropos '':''';
		Position := 1;
		Width := 32;
		AllowSizing := False;
	end;
	with (IUnknown(Columns.Add('Pos.3')) as EXG2ANTTLib_TLB.Column) do
	begin
		FormatColumn := '1 ropos '':|A-Z''';
		Position := 2;
		Width := 32;
		AllowSizing := False;
	end;
	with (IUnknown(Columns.Add('Pos.4')) as EXG2ANTTLib_TLB.Column) do
	begin
		FormatColumn := '1 ropos ''|A-Z|''';
		Position := 3;
		Width := 32;
		AllowSizing := False;
	end;
	with (IUnknown(Columns.Add('Pos.5')) as EXG2ANTTLib_TLB.Column) do
	begin
		FormatColumn := '''<font Tahoma;7>'' + 1 ropos ''-<b>||A-Z''';
		Def[EXG2ANTTLib_TLB.exCellValueFormat] := OleVariant(1);
		Position := 4;
		Width := 32;
		AllowSizing := False;
	end;
	with (IUnknown(Columns.Add('Pos.6')) as EXG2ANTTLib_TLB.Column) do
	begin
		FormatColumn := '''<b>''+ 1 ropos ''</b>:<fgcolor=FF0000>|A-Z|''';
		Def[EXG2ANTTLib_TLB.exCellValueFormat] := OleVariant(1);
		Position := 5;
		Width := 48;
		AllowSizing := False;
	end;
	with Items do
	begin
		h := AddItem('Root 1');
		InsertItem(h,Null,'Child 1');
		InsertItem(h,Null,'Child 2');
		ExpandItem[h] := True;
		h := AddItem('Root 2');
		InsertItem(h,Null,'Child 1');
		InsertItem(h,Null,'Child 2');
	end;
	ApplyFilter();
	EndUpdate();
end
|
|
1301
|
Is it possible to auto-numbering the children items too
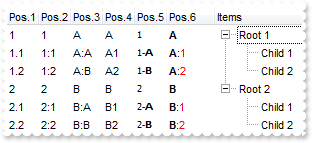
with G2antt1 do
begin
	BeginUpdate();
	Chart.PaneWidth[True] := 0;
	LinesAtRoot := EXG2ANTTLib_TLB.exLinesAtRoot;
	Columns.Add('Items');
	with (IUnknown(Columns.Add('Pos.1')) as EXG2ANTTLib_TLB.Column) do
	begin
		FormatColumn := '1 rpos ''''';
		Position := 0;
		Width := 32;
		AllowSizing := False;
	end;
	with (IUnknown(Columns.Add('Pos.2')) as EXG2ANTTLib_TLB.Column) do
	begin
		FormatColumn := '1 rpos '':''';
		Position := 1;
		Width := 32;
		AllowSizing := False;
	end;
	with (IUnknown(Columns.Add('Pos.3')) as EXG2ANTTLib_TLB.Column) do
	begin
		FormatColumn := '1 rpos '':|A-Z''';
		Position := 2;
		Width := 32;
		AllowSizing := False;
	end;
	with (IUnknown(Columns.Add('Pos.4')) as EXG2ANTTLib_TLB.Column) do
	begin
		FormatColumn := '1 rpos ''|A-Z|''';
		Position := 3;
		Width := 32;
		AllowSizing := False;
	end;
	with (IUnknown(Columns.Add('Pos.5')) as EXG2ANTTLib_TLB.Column) do
	begin
		FormatColumn := '''<font Tahoma;7>'' + 1 rpos ''-<b>||A-Z''';
		Def[EXG2ANTTLib_TLB.exCellValueFormat] := OleVariant(1);
		Position := 4;
		Width := 32;
		AllowSizing := False;
	end;
	with (IUnknown(Columns.Add('Pos.6')) as EXG2ANTTLib_TLB.Column) do
	begin
		FormatColumn := '''<b>''+ 1 rpos ''</b>:<fgcolor=FF0000>|A-Z|''';
		Def[EXG2ANTTLib_TLB.exCellValueFormat] := OleVariant(1);
		Position := 5;
		Width := 48;
		AllowSizing := False;
	end;
	with Items do
	begin
		h := AddItem('Root 1');
		InsertItem(h,Null,'Child 1');
		InsertItem(h,Null,'Child 2');
		ExpandItem[h] := True;
		h := AddItem('Root 2');
		InsertItem(h,Null,'Child 1');
		InsertItem(h,Null,'Child 2');
	end;
	EndUpdate();
end
|